
Every successful American sports bettor knows that raw intuition is no match for hard data. With billions wagered annually on NBA and NFL games, the most profitable strategies come from mastering analytics and spotting hidden trends. By building a solid foundation of high-quality data sources and effective analytic tools, you can transform complex statistics into a powerful edge over the competition—no matter where you bet.
Table of Contents
- Step 1: Set up Essential Data Sources and Analytics Tools
- Step 2: Analyze Key Statistics Relevant to Your Sport
- Step 3: Spot Patterns and Anomalies in Betting Markets
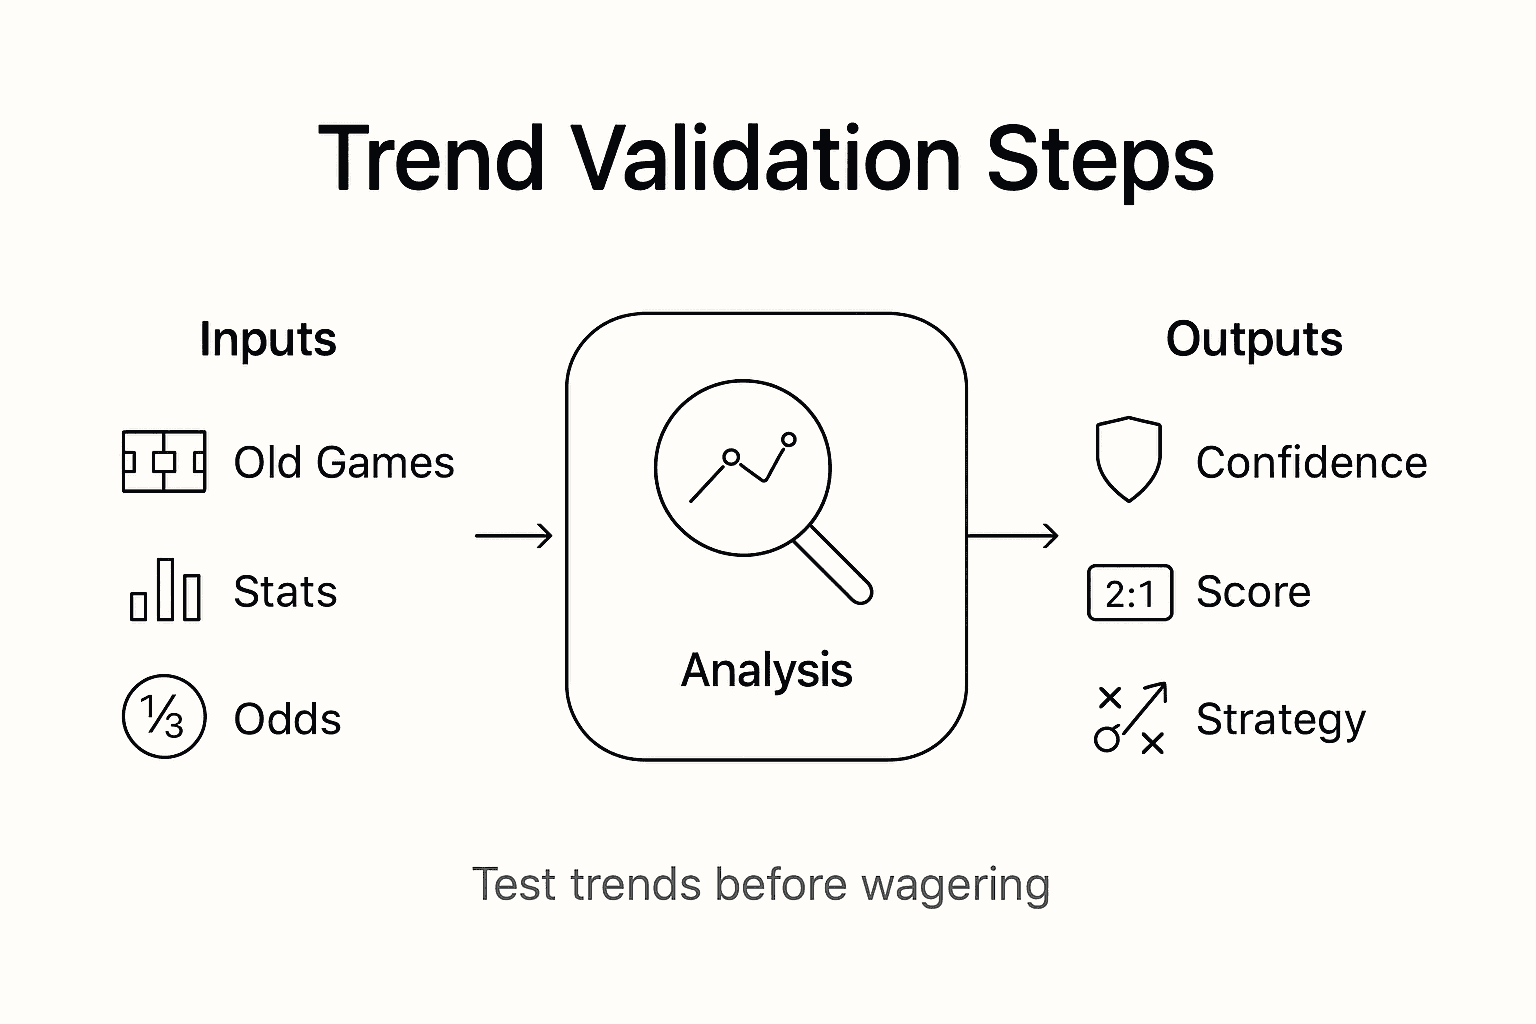
- Step 4: Validate Identified Trends with Historical Data
- Step 5: Monitor and Adjust Based on Ongoing Results
Quick Summary
| Key Insight | Explanation |
|---|---|
| 1. Establish Data Collection | Create a strategy to compile data from official leagues and statistics to gain actionable insights for betting. |
| 2. Utilize Analytics Tools | Leverage tools like Excel, SQL, and Python to analyze performance metrics and trends strategically. |
| 3. Monitor Betting Patterns | Identify discrepancies and anomalies in betting markets to uncover valuable opportunities for profit. |
| 4. Validate Trends with History | Use historical sports data to confirm emerging trends and ensure they provide genuine predictive value. |
| 5. Adjust Strategies Regularly | Continuously track performance and refine models based on results to adapt to changing betting landscapes. |
Step 1: Set up essential data sources and analytics tools
Setting up robust data sources and analytics tools is the foundation of smart sports betting. You will build an information ecosystem that transforms raw data into actionable betting insights.
Start by creating a comprehensive data collection strategy. Focus on multiple high-quality information streams like official league websites and statistical databases. Professional sports leagues offer comprehensive player performance metrics, team statistics, historical matchup data, and real-time updates. Supplement these official sources with sports news platforms, betting sites, and specialized analytics websites to get a 360-degree view of potential betting opportunities.
Next, select your analytics tools strategically. Professional bettors typically use spreadsheet software like Microsoft Excel, database management systems such as SQL, and programming languages like Python for advanced data manipulation. These tools allow you to clean, organize, and analyze massive datasets efficiently. Create custom spreadsheet templates that track key performance indicators, build predictive models, and generate visual representations of trends. Consider learning basic data analysis techniques to transform raw numbers into meaningful betting signals.
Pro Tip: Create automated data collection scripts that pull statistics from multiple sources daily, saving you hours of manual research and ensuring you always have the most current information available.
Here’s a comparison of commonly used analytics tools for sports betting and their key strengths:
| Tool | Primary Function | Strengths for Sports Betting |
|---|---|---|
| Microsoft Excel | Data organization, modeling | Easy to use, good for custom sheets |
| SQL | Database management | Handles large datasets efficiently |
| Python | Advanced analysis, scripting | Powerful for automation, modeling |
Step 2: Analyze key statistics relevant to your sport
Understanding how to analyze key sport-specific statistics is critical for developing profitable betting strategies. You will learn to break down complex performance metrics and transform raw numbers into actionable betting insights.
Start by identifying the most relevant performance indicators for your specific sport. In basketball, this might include shooting percentages, player efficiency ratings, and defensive metrics. Machine learning techniques can help uncover nuanced statistical relationships that traditional analysis might miss. For example, tracking a point guard’s assist to turnover ratio can reveal more about team performance than simple point totals. Similarly, in football, look beyond basic passing yards and examine metrics like completion percentage under pressure, red zone efficiency, and third down conversion rates.

Develop a systematic approach to analyzing these statistics by creating detailed tracking sheets. Break down individual player and team performance across multiple dimensions. Use visualization tools to spot trends and anomalies that bookmakers might overlook. Pay special attention to situational statistics that show how teams perform under specific conditions like away games, night games, or against particular defensive strategies. The goal is to build a comprehensive statistical profile that gives you a meaningful edge in predicting game outcomes.
Pro Tip: Create a standardized statistical scoring system that weights different performance metrics according to their predictive power, allowing you to quickly assess betting value across multiple sports and scenarios.
Step 3: Spot patterns and anomalies in betting markets
Identifying subtle patterns and market anomalies is your pathway to discovering hidden betting opportunities that most bettors overlook. Your goal is to develop a keen analytical eye that can detect irregularities in betting markets before they become obvious to everyone else.
Advanced anomaly detection techniques reveal that betting markets often contain non-transitive patterns that bookmakers inadvertently create. Watch for consistent discrepancies in betting lines across different bookmakers, unusual shifts in odds just before game time, and statistical variations that deviate from expected performance metrics. For instance, track how betting volumes change for specific teams or players under certain conditions such as weather patterns, injury reports, or historical performance trends. Pay special attention to moments when public sentiment seems to diverge dramatically from statistical probabilities.
Build a systematic approach to tracking these anomalies by creating comprehensive comparison spreadsheets that monitor betting lines, historical odds movements, and real-time market shifts. Use data visualization tools to help you quickly identify statistical outliers and unexpected betting patterns. Cross reference multiple data sources to validate your observations and look for consistent irregularities that could represent genuine value opportunities. Remember that the most profitable insights often emerge from careful, patient analysis rather than impulsive betting decisions.
Pro Tip: Develop a disciplined tracking system that logs potential market anomalies with detailed notes about context, timing, and potential explanations to refine your pattern recognition skills over time.
This table summarizes key types of market anomalies and their impact on betting strategy:
| Anomaly Type | What It Indicates | Strategic Opportunity |
|---|---|---|
| Odds Discrepancies | Mispricing across bookmakers | Find value bets |
| Late Line Shifts | Market reacts to new info | Detect sharp money or key updates |
| Volume Surges | Unusual betting activity | Signal unexpected events or trends |
| Sentiment Deviations | Public vs. statistical odds gap | Contrarian betting opportunities |
Step 4: Validate identified trends with historical data
Validating betting trends requires a systematic approach to analyzing past performance and understanding the statistical significance of emerging patterns. Your objective is to transform raw observations into reliable predictive insights that can guide smarter betting decisions.
Historical sports data provides a critical foundation for trend validation, offering deep insights into performance consistency and potential future outcomes. Start by creating comprehensive databases that track long-term performance metrics across multiple seasons. Analyze head-to-head records, situational statistics, and player performance under various conditions to determine whether an identified trend represents a genuine strategic advantage or a temporary statistical anomaly. Look for patterns that demonstrate consistent performance over extended periods rather than short term fluctuations that could be attributed to random chance.
Develop a robust validation framework that applies statistical rigor to your trend analysis. Calculate confidence intervals, standard deviations, and regression models to assess the reliability of your observations. Compare current performance metrics against historical baselines to understand how existing trends deviate from expected outcomes. Pay special attention to contextual factors like roster changes, coaching strategies, and environmental conditions that might influence performance trends. Remember that true predictive power comes from understanding the underlying dynamics that drive statistical patterns.
Pro Tip: Create a standardized scoring system that weights historical performance metrics differently based on their predictive reliability, allowing you to quickly assess the statistical strength of emerging betting trends.
Step 5: Monitor and adjust based on ongoing results
Successful sports betting requires continuous learning and adaptation. Your goal is to develop a dynamic approach that evolves with changing performance dynamics and market conditions.
Statistical frameworks for dynamic decision making emphasize the critical importance of ongoing model refinement and performance tracking. Implement a systematic review process that involves weekly and monthly assessments of your betting strategies. Track key performance indicators such as return on investment, win rates, and deviation from expected outcomes. Pay close attention to how your predictive models perform under different sporting contexts and be prepared to recalibrate your approach when empirical results consistently diverge from your initial assumptions.
Develop a robust feedback loop that allows for rapid strategy adjustment. Create detailed performance logs that document not just wins and losses, but the underlying reasoning behind each bet. Analyze the factors that contributed to successful predictions and those that led to unexpected outcomes. Use statistical regression techniques to understand the predictive power of different variables and continuously refine your models. Remember that betting is an iterative process where your ability to learn and adapt is more important than any single prediction.
Pro Tip: Set up automated tracking spreadsheets that calculate your rolling performance metrics and generate visual alerts when your betting strategy deviates significantly from expected statistical performance.
Unlock Profitable Betting Trends with Data-Driven Insights
The article reveals the challenges of identifying reliable betting trends through complex statistics, market anomalies, and historical validation. If you struggle with transforming raw data into consistent Positive EV opportunities or finding those subtle market patterns, you are not alone. You want a proven system that goes beyond gut feelings and spotty research to give you a real edge in sports betting.
Stats Bench is designed exactly for bettors like you. Our daily models analyze thousands of data points—from player performance to situational matchups—helping you spot undervalued bets across NBA Player Props, NFL Spreads, and NHL Shot Totals. We bridge the gap between casual gambling and true mathematical investing by delivering actionable insights that capitalize on market inefficiencies. Explore how our tools simplify trend validation and ongoing strategy adjustments so you can make smarter, long-term wagers.
Take the next step to harness the power of data with Stats Bench Cheat Sheet and see how advanced analytics transform your betting approach. Visit Stats Bench Cheat Sheet now to get started with actionable trends you can trust and join a community of bettors winning with confidence.

Frequently Asked Questions
What are the key statistics I should analyze for different sports?
To identify betting trends effectively, focus on sport-specific performance indicators. For example, in basketball, track shooting percentages and player efficiency ratings, while in football, examine completion rates and red zone efficiency. Create detailed tracking sheets tailored to each sport to visualize these statistics and spot trends.
How can I validate emerging betting trends using historical data?
Validate your trends by comparing current metrics against historical performance. Analyze head-to-head records and situational statistics over multiple seasons to see if trends are consistent or merely anomalies. Use statistical tools to calculate confidence intervals, ensuring you make informed betting decisions.
What types of market anomalies should I monitor for better betting opportunities?
Pay attention to odds discrepancies across bookmakers, late line shifts, and unusual betting volume surges. These anomalies often indicate potential mispricings or unexpected trends. Create a systematic tracking spreadsheet to log these anomalies and analyze their impact on your betting strategy.
How often should I adjust my betting strategies based on performance?
Regularly review your betting strategies through weekly and monthly assessments. Track key performance indicators like return on investment and win rates, and make adjustments whenever your results deviate significantly from expectations. This ongoing refinement helps enhance your long-term betting success.
What tools can help me automate my data collection and analysis for betting trends?
Use spreadsheet software, database management systems, or programming languages for automation. For example, create automated scripts in a language like Python that collect and organize statistics from various sources daily. This will save time and keep your data current, enabling better analysis and decision-making.