

Learning how to remove the vig takes about 20 seconds of math. Convert both sides of a market into implied probability, add those two numbers, then divide each side by the total so the pair sums to 100%. What’s left is the no-vig fair price, and that’s the number every bet should be measured against. Without it, you’re guessing whether a prop is priced well or just looks good.
Here’s the full method, the version to use when the two sides aren’t close to even, and a real NFL board example of what the math looks like in practice.
What is the vig on a prop bet?
The vig (also called juice or the hold) is the sportsbook’s commission. It isn’t charged as a fee, it’s baked into the odds. A two-way market at -110 on both sides is the standard example: each side implies a 52.4% chance, and 52.4 plus 52.4 comes to 104.8%. That extra 4.8% is the book’s cut.
Props usually carry more hold than sides and totals. Thinner markets, less money on each side, more margin built in. That isn’t a reason to avoid player props. It’s a reason to be pickier about the price you accept.
Quick check: add the implied probabilities of both sides. If the total is above 100%, you’re paying vig, and the size of the overage tells you how much.
| Market | Side A | Side B | Total | Hold |
|---|---|---|---|---|
| -110 / -110 | 52.4% | 52.4% | 104.8% | 4.8% |
| -150 / +130 | 60.0% | 43.5% | 103.5% | 3.5% |
| -200 / +170 | 66.7% | 37.0% | 103.7% | 3.7% |
Those totals come straight from the posted odds. No hidden assumptions, just arithmetic most bettors never run.
How to remove the vig, step by step
Use the -150 / +130 market from the table. Four steps, no spreadsheet required.
- Convert each side to implied probability. Negative price: odds divided by (odds + 100), so 150 / 250 = 60.0%. Positive price: 100 divided by (odds + 100), so 100 / 230 = 43.5%.
- Add them. 60.0% + 43.5% = 103.5%.
- Divide each side by that total. 60.0 / 103.5 = 58.0%. 43.5 / 103.5 = 42.0%. The pair now sums to exactly 100%.
- Convert back to American odds. 58.0% is roughly -138. 42.0% is roughly +138.
That -138 / +138 is the market’s real opinion with the book’s tax stripped out. Now the useful part. If a second book hangs -125 on the 58% side, you’re taking a price that pays as if the chance were 55.6%, when the de-vigged market says 58.0%. Run it through and that’s about a 4.4% edge. That gap is where the money comes from.
New to the concept? This post on implied probability explains why 52.4% is the only break-even number you need at -110. The free de-vig calculator and implied probability calculator handle both conversions for you.
Multiplicative or power method: which de-vig is right?
Direct answer: for uneven prices, the power method is the better default, and it’s what StatsBench uses. The proportional (multiplicative) split assumes the book spreads its hold evenly across both sides. Books don’t. They shade longshots harder, a pattern known as favorite-longshot bias.
The power method raises both implied probabilities to an exponent and solves until they sum to 1. In practice that pulls more of the hold off the underdog’s side. On a -200 / +170 market, the simple split gives you 64.3% / 35.7%. The power method lands closer to 65.1% / 34.9%.
That looks like rounding noise. It isn’t. It’s the difference between calling a +170 longshot fairly priced and spotting that it’s a couple of points short of a bet. Rule of thumb: near even money, either method works fine. If one side is +200 or longer, use the power method.
What do you actually do with a no-vig price?
A no-vig price is not a prediction. It’s the market’s consensus with the tax removed, which makes it the cleanest baseline available for judging a line. Your research says one thing, the fair price says another, the book offers a third. Bet when the book’s number beats fair by enough to survive variance, and pass when it doesn’t.
It also shows you how much a specific book is shading each side. If the hold on one prop is running fat, that tells you something about how that book expects the money to land.
The better scoreboard is what you beat the fair price by, not tonight’s result. Take prices above the no-vig number consistently and you’re doing the one thing profitable bettors do on purpose.
A real example from an NFL prop board
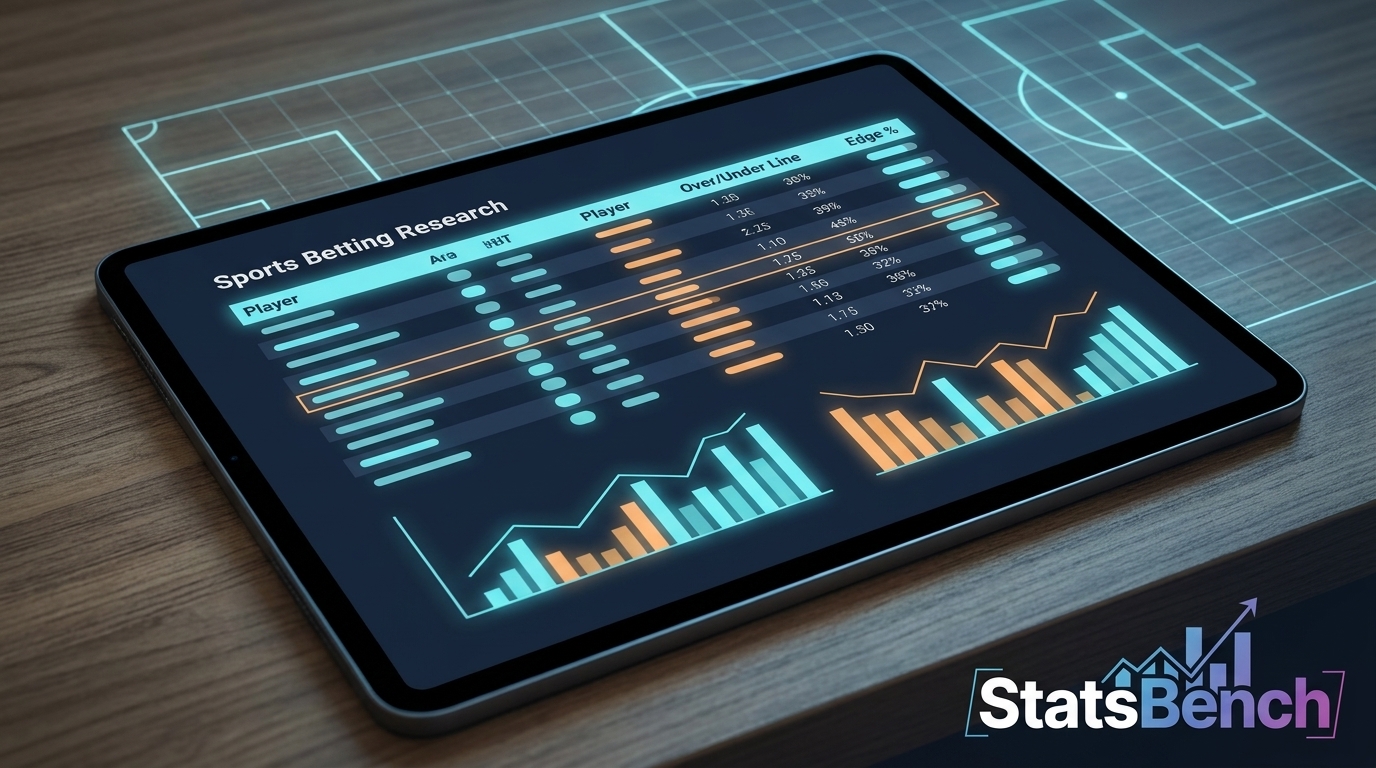
Here’s what that edge column looks like on live data. In a StatsBench snapshot from September 29, 2026, Aaron Rodgers’ passing yards line sat at 210.5 with a best available price of -110 across the roughly 60 sportsbooks StatsBench tracks. He’d cleared that number in 6 of his last 10 games, and the edge column read 9.4% against the de-vigged fair price.
Two more rows from the same snapshot tell the other half of the story. Pat Freiermuth’s receiving yards line (29.5) also came in 6 of 10 with a best price of -110, but only a 3.8% edge. DK Metcalf’s receptions line at 3.5 showed the same 60% hit rate at -114, with an edge of 0.5%.
Key takeaway: three props, the same hit rate, three very different prices. The hit rate isn’t the edge. The distance between the posted price and the fair price is.
One caution: don’t treat 6 of 10 like a law of nature. Ten games is a small sample, and sample size is the first thing to check before you trust any percentage. Receiving and total-yards markets also behave differently than a quarterback’s passing line, which we broke down in this guide to NFL total yards props.
Why line shopping changes the vig you really pay
Two books can hang the same prop at -110 and -125. The de-vig math barely moves, but your hurdle does. Break-even at -110 is 52.4%. At -125 it’s 55.6%. Same bet, three extra percentage points of win rate required.
You can turn any price into a break-even percentage with the free odds converter. Or let the software do it. StatsBench compares prices across roughly 60 sportsbooks and shows the best available number for every prop it scores, which is how a best-price column gets built at all. Doing that by hand across a full Sunday slate isn’t realistic. The NFL props board does it in one table.
If you want to check a player’s game log yourself, NFL.com is the source of record for the numbers everyone else grades against.
Where the de-vig math runs inside StatsBench
StatsBench recomputes fair prices from sharp books (Pinnacle, Betfair Exchange, Bookmaker.eu, Circa) about every minute, de-vigs with the power method, and compares each fair price to the best soft-book price it can find. Every prop also carries an EV percentage you can filter in Prop Finder next to hit rate, consistency grades, and defensive matchup data. The free tier shows a teaser feed up to a 0.5% edge. Pro opens the full feed across the books tracked.
None of this is a picks service. It’s a research desk: the numbers, the sample, and your read on top of them.
One honest note before you go. Nothing about de-vigging makes a bet safe, and a 1% to 3% edge is supposed to lose on plenty of individual nights. That’s variance, not a broken process. Bet within your means, it’s 21+, and if betting stops being fun, 1-800-GAMBLER is free and confidential.
Live board
See today’s NFL player props on StatsBench
Live lines, last-10 hit rates and the best price across about 60 books.
Open the NFL player props board →
Prefer email? Get the daily picks newsletter.
Frequently Asked Questions
How do you calculate the vig on a prop bet?
Convert both sides of the market to implied probability, add them together, and subtract 100%. A -110 / -110 market adds up to 104.8%, so the vig is 4.8%. If the total sits at 103%, the hold is 3%.
What’s the difference between the multiplicative and power de-vig methods?
The multiplicative method splits the hold proportionally across both sides. The power method assumes books shade longshots harder than that, so it trims more of the hold off the underdog’s fair probability. StatsBench uses the power method, and it matters most on prices of +200 or longer.
Does removing the vig tell you which side to bet?
No. It gives you a fair baseline to compare the book’s price against. You still need a reason to believe the market’s number is wrong, whether that’s a role change, a matchup, or a line that hasn’t moved yet.
Is a 60% hit rate good on a prop?
It depends entirely on the price. At -110 you need about 52.4% to break even, so 60% is meaningful at that number. But a 10-game sample is small, and the line may already reflect the trend by the time you see it.
Can I remove the vig without a tool?
Yes. It’s four steps and basic arithmetic: convert each side to implied probability, add them, divide each side by the total, then convert back to American odds. The free de-vig calculator on StatsBench does the same thing in two clicks.