You open your betting app. You click on a player prop.
You see a beautiful sea of green.
LeBron James: Over 24.5 Points.
- Last 5 Games: ✅ ✅ ✅ ✅ ❌
- Last 10 Games: 80% Hit Rate.
It looks like a lock. It feels like free money. You smash the “Over.”
And then he scores 18 points and kills your parlay.
What happened?
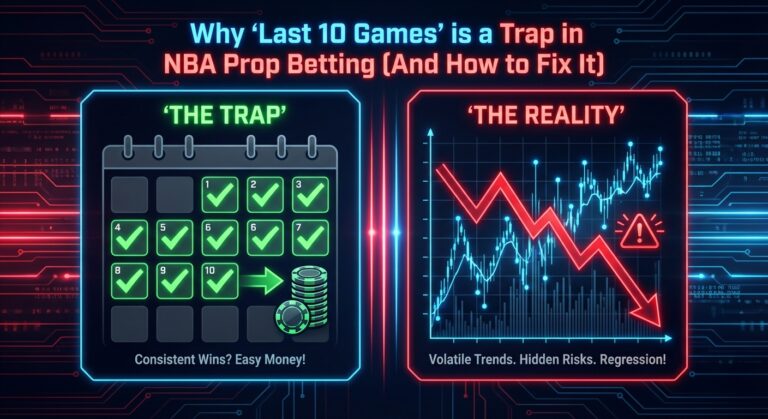
You fell for the “Last 10 Trap.”
“Last 10 Games” is the most popular metric in betting, and sportsbooks know it. They price their lines specifically to trap bettors who only look at recent logs without asking why those numbers happened.
Here is why raw trends are mostly noise, and the specific filters you need to apply to turn that noise into a winning signal.
The Problem: Context is King
A trend is only useful if the conditions stay the same. In the NBA, conditions change every night.
If a player averaged 28 points over his last 10 games, you need to ask:
- Was the star player injured? (Did he get more shots because the #1 option was out?)
- Who did they play? (Did they play the Wizards and Pistons three times?)
- Was there garbage time? (Did he score 10 meaningless points in the 4th quarter of a blowout?)
If you don’t answer these questions, you aren’t handicapping. You’re just reading history.
Filter 1: The “Minutes Floor” (The BS Detector)
This is the first filter we apply at StatsBench.
A player’s production is directly tied to his minutes.
The Scenario:
A bench player has hit the “Over” on his Rebounds prop in 4 straight games.
- Game 1: 28 Minutes (Starter was hurt).
- Game 2: 30 Minutes (Double Overtime).
- Game 3: 26 Minutes (Blowout win).
- Game 4: 24 Minutes (Starter in foul trouble).
The Trap:
Tonight, the starter is back, the spread is close, and there is no overtime. He is projected for his normal 18 minutes.
If you bet the “Last 10 Trend,” you lose. The opportunity is gone.
The Fix:
Use a Minutes Filter.
Only look at the games where the player played his projected rotation (e.g., “Show me his stats only when he plays less than 20 minutes”). Suddenly, that “Hot Streak” turns into a “Cold Streak.”
Filter 2: The “Usage Stability” Check
We covered this in our Usage Rate Guide, but it bears repeating: Volume > Efficiency.
Sometimes a player gets hot. He hits four 3-pointers in a row. His points spike.
But his Usage Rate didn’t change. He just got lucky.
Luck runs out. Volume stays.
The Fix:
Before believing a “Last 10” scoring trend, check the Shot Attempts.
- If his Points went up, but his Shot Attempts stayed the same? Fade him. (He is due for regression).
- If his Points went up AND his Shot Attempts went up? Tail him. (His role has actually grown).
Filter 3: The Matchup (Pace & Defense)
A trend is useless if the opponent changes the math.
You might have a Center who has hit his Rebound Over in 9/10 games.
But those games were against teams that miss a lot of shots and play fast.
Tonight, he plays the New York Knicks.
- They play at the slowest pace in the league (fewer possessions).
- They are an elite rebounding team.
The Fix:
Don’t look at “Last 10 Overall.”
Look at “Last 10 vs. Top 10 Defenses.”
StatsBench allows you to see how a player performs specifically against “Tough Matchups.” Often, a superstar’s average drops by 15-20% when facing an elite defense. The books know this. Do you?
How to use “Rolling Trends” Correctly (The Checklist)
We aren’t saying you should ignore recent form. We are saying you should scrub it.
Here is the StatsBench checklist before locking in a bet based on a trend:
- Apply the Minutes Floor: Filter out games where they played <25 minutes (unless betting an Unders Blowout Strategy).
- Check the Injury Report: Is the roster the same as it was during the “Hot Streak”? If a key teammate returns, the trend is dead.
- Tag the Matchup: Is the opponent Pace similar? If tonight is a “Pace Down” spot, lower your expectation.
- Remove the Outliers: If one game in the Last 10 was a 50-point explosion, remove it from the average. Does the trend still hold up without that one freak night?
Summary: Be a Skeptic
The sportsbooks rely on you being lazy. They want you to see “80% Hit Rate” and bet blindly.
Be the bettor who clicks one level deeper.
If a trend survives the Minutes Filter and the Matchup Check, then it’s a bet. If it falls apart the moment you apply context, leave it for the public to lose money on.
Run these filters instantly on the StatsBench Player Props Tool
Frequently Asked Questions
A rolling average looks at a player’s stats over a moving window of time (e.g., the last 5, 10, or 20 games) rather than their whole season. This helps identify recent form, “hot streaks,” or slumps that season-long averages might hide.
Usually, yes. Most trend tools count the last 10 games played chronologically, regardless of whether they were regular season or playoff games. However, be careful using playoff data for regular-season bets, as minutes and intensity are often much higher in the playoffs.
If a player is a Game Time Decision, be very careful with his teammates’ trends. If the star plays, the teammates’ usage will drop. If he sits, their usage rises. We recommend waiting until the final lineup is confirmed before trusting the trend.