
What a z-score chart actually tells a bettor
A z-score chart converts a distance from the average into a probability. For prop bettors, that’s the whole point: you want to know how likely a player is to clear a number, not just whether the number “feels” low. Feed a chart a player’s average, their game-to-game spread, and the posted line, and it spits out a rough probability of going over.
That probability is your fair price. Compare it to the book’s implied odds and you know whether you’re getting paid enough. Everything else in prop research is just refining those three inputs.
This guide keeps the math light. We’ll walk the calculation once, show a real example using StatsBench cheatsheet data from an August 2026 slate, then spend most of our time on where this tool lies to you.
How do you calculate a z-score for a player prop?
The formula is short. Subtract the player’s average from the line, then divide by the standard deviation of their game results.
z = (line − average) ÷ standard deviation
Say a WNBA center averages 16 points with a standard deviation of 5, and the line sits at 14.5. That’s (14.5 − 16) ÷ 5 = −0.30. A negative z means the line sits below her average, so the over is favored.
Now look up −0.30 on a standard normal table. Roughly 62% of outcomes land above that point. So your rough fair probability for the over is about 62%, which is around −163 in American odds.
Turning the number into a price
Implied probability and odds are two views of the same thing. If your estimate says 62% and the book prices the over at −110 (about 52.4% implied), you’ve found a gap worth a second look. If the book has it at −180, the edge is gone.
We break the 52.4% breakeven math down in detail in our implied probability guide. Read that first if odds-to-probability conversion isn’t automatic for you yet.
A worked example with real prop data
Here’s why the standard deviation matters more than most bettors think. Take a snapshot from StatsBench’s cheatsheet on an August 1, 2026 WNBA slate, Chicago vs Las Vegas. Kamilla Cardoso showed up on five different prop types, all at a 60% hit rate over her last 10 games:
| Prop | Line | Hit rate (L10) | Edge | Best price |
|---|---|---|---|---|
| Points + assists | o/u 16.5 | 60% (6/10) | 3.1% | -125 |
| Points | o/u 14.5 | 60% (6/10) | 2.5% | -110 |
| Points + rebounds + assists | o/u 25.5 | 60% (6/10) | 1.8% | -111 |
| Points + rebounds | o/u 23.5 | 60% (6/10) | 1.2% | -106 |
| Rebounds | o/u 7.5 | 60% (6/10) | 0.2% | -125 |
Same player, same night, same hit rate. The modeled edge ranged from 0.2% to 3.1%. That spread comes from pricing, not from talent.
The rebounds prop at -125 needs about 55.6% to break even. Her raw 6-of-10 clears that, barely, and the edge shrinks to almost nothing once you de-vig properly. The points+assists market at the same -125 showed 3.1%. The line you pick matters as much as the player you pick.
Where a normal-distribution chart breaks down in sports
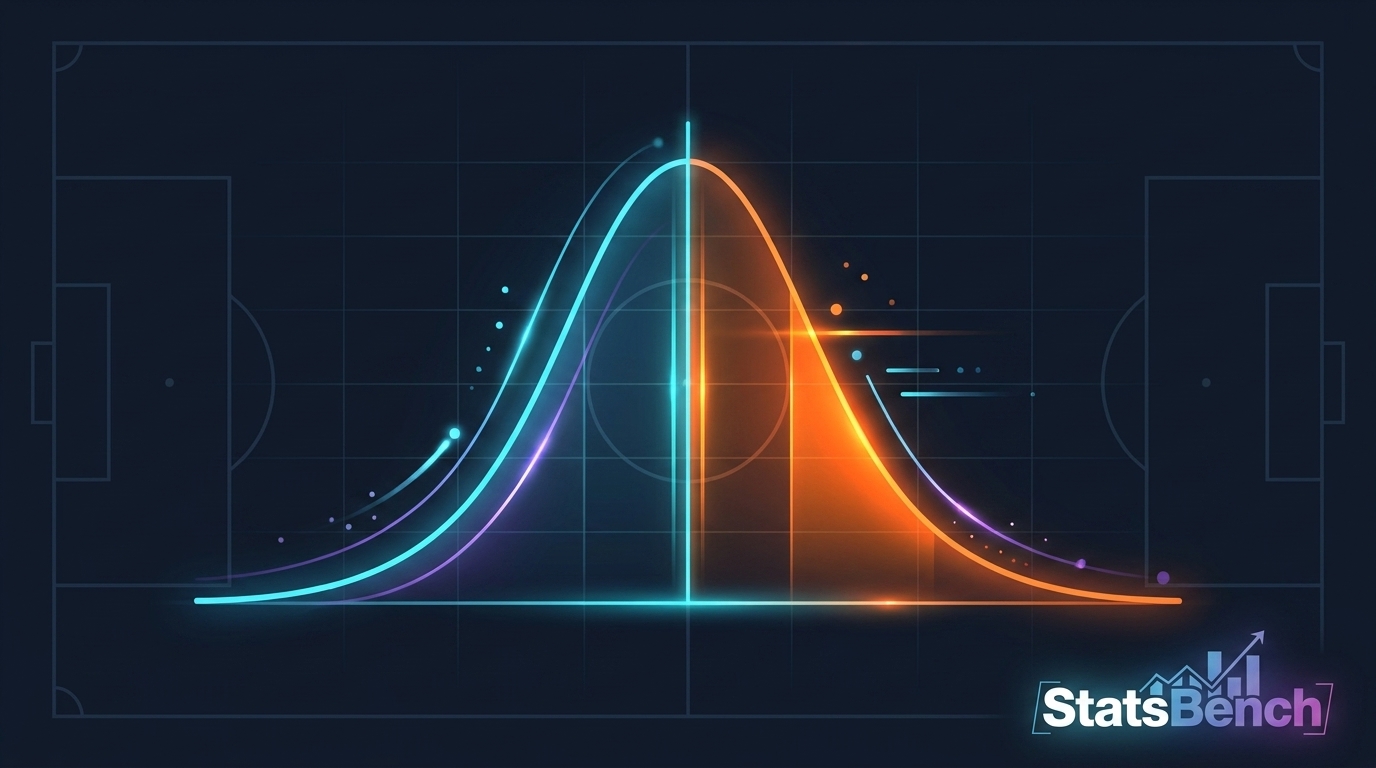
A z-score chart assumes a bell curve. Plenty of sports stats aren’t shaped like one, and that’s where bettors get burned.
- Counting stats with a floor at zero. Home runs, goals, and receiving touchdowns cluster at 0 and 1. There’s no left tail. A normal chart will hand you nonsense probabilities on a 0.5 line.
- Small samples. Ten games is not enough to estimate a standard deviation with confidence. Six-of-ten looks like 60%, but the true range around that is wide.
- Blowouts and rotations. Minutes drive prop outcomes. A 25-point win truncates the star’s fourth quarter and the distribution goes lopsided.
- Injuries and role changes. If a teammate goes down, last month’s average describes a different player than the one who tips off tonight.
Sports data is skewed more often than it’s symmetric. For a deeper look at why raw averages mislead on props, see our piece on distributions in betting. If you want the formal definition of the underlying curve, Wikipedia’s normal distribution page covers it well.
Better distributions for common props
Pros swap in different shapes depending on the stat:
- Poisson for low-frequency counts: goals, home runs, made threes at low volume.
- Negative binomial when the variance runs hotter than a Poisson allows (strikeouts often do).
- Normal-ish approximations for high-volume totals: points, combined PRA, total bases over long stretches.
You don’t need to build these yourself. You just need to know that a bell curve is a starting assumption, not a law.
Reading standard deviation like a bettor, not a student
Standard deviation is your consistency dial. Two players can average the same number and offer completely different bets.
Picture two WNBA guards, both averaging 12 points. One goes 11, 13, 12, 12, 13. The other goes 4, 22, 6, 19, 9. On a line of 10.5, the steady guard is a much better over. The volatile guard is a coin flip dressed up as an average.
That’s exactly what StatsBench’s Consistency Grades capture, a 0 to 100 score per prop you can filter on directly. Low deviation plus a line under the average is the cleanest setup a z-score approach can find.
The quick sanity check
- Pull the player’s last 15 to 25 game logs for that stat.
- Note the average and eyeball the spread (highest, lowest, typical swing).
- Compute the z-score for the posted line.
- Convert to probability, then to odds.
- Shop the price. If no book pays better than your fair number, pass.
Step five kills more bad bets than steps one through four combined. Line shopping across ~60 books is boring work, and it’s free closing line value.

Z-scores versus hit rates: which should you trust?
Use both, for different jobs. A hit rate answers “how often has this happened?” A z-score answers “how often should this happen, given the shape of the data?”
Hit rates are intuitive and easy to check. They’re also blunt. A 6-of-10 tells you nothing about whether the misses were near-misses or blowouts. A prop that missed by half a rebound five times is a very different bet than one that missed by six points five times.
The z-score approach uses the whole distribution, including the near-misses. That’s its real advantage. Its weakness is the assumption we already covered. So triangulate: hit rate for the gut check, distribution for the fair price, matchup context for the tiebreaker.
Sample size sits underneath all of it. Our guide on how much sample is enough explains why 10 games rarely settles anything.
How StatsBench does this work for you
You can build a z-score spreadsheet. Plenty of sharp bettors have. The problem is scale: every prop type, every player, every night, across dozens of books.
StatsBench scores props on hit rate, EV%, consistency, and an SB Score, then lets you filter. The Positive EV Scanner goes a step further, recomputing fair prices from sharp books about every minute and flagging where soft books lag behind. It de-vigs with the power method and includes Kelly staking options, so your bet sizing follows the same math as your edge.
For baseball specifically, the MLB strikeout tool aggregates pitch mix, whiff rates, and opponent K-vulnerability by hand and pitch type. It’s matchup research, not a projection, and it’s the kind of context a z-score alone can’t see.
Keep it in perspective
A probability estimate is a claim about the long run, not a prediction about one night. A 62% over loses about four times in ten. That’s not the model failing. That’s the model working exactly as advertised.
Bet amounts you’re fine losing, treat it as entertainment, and remember that variance cuts both ways over any short stretch. Sports betting is 21+ and legality varies by state. If it stops being fun, call 1-800-GAMBLER.
Want to see distribution-aware scoring applied to a full slate instead of one spreadsheet tab? Open the Positive EV Scanner and sort by edge. The free tier shows the teaser feed up to 0.5% edge, which is plenty to check whether the method matches how you already think.
Free preview
See today’s MLB player props on StatsBench
Live lines, last-10 hit rates and the best price across about 60 books. No account needed to look.
Open the MLB player props board →
Prefer email? Get the daily picks newsletter.
Frequently Asked Questions
What is a z-score in sports betting?
A z-score measures how far a prop line sits from a player’s average, expressed in standard deviations. Negative means the line is below the average, which favors the over. You then convert that z-score to a probability using a standard normal table.
How do I convert a z-score to a betting probability?
Look the z-score up on a standard normal table, which gives the share of outcomes below that point. Subtract from 1 to get the over probability. Then convert that probability into American odds and compare it against the best price you can find.
Is a normal distribution accurate for player props?
It works reasonably for high-volume stats like points or combined PRA. It breaks down badly for low-count props like home runs or goals, where results cluster at zero and one. Poisson or negative binomial models fit those markets much better.
Why do two props with the same hit rate have different edges?
Because pricing differs. In a StatsBench snapshot from an August 2026 WNBA slate, five Kamilla Cardoso props all sat at a 60% hit rate over 10 games but showed edges from 0.2% to 3.1%. The line and the odds attached to it drive the value, not the hit rate alone.
How many games do I need before trusting a standard deviation?
More than ten. Ten games gives a very wide confidence range around both the average and the spread. Fifteen to twenty-five games for the current role is a more reasonable floor, and role changes reset the clock.