
<
MAD vs standard deviation: which should you use?
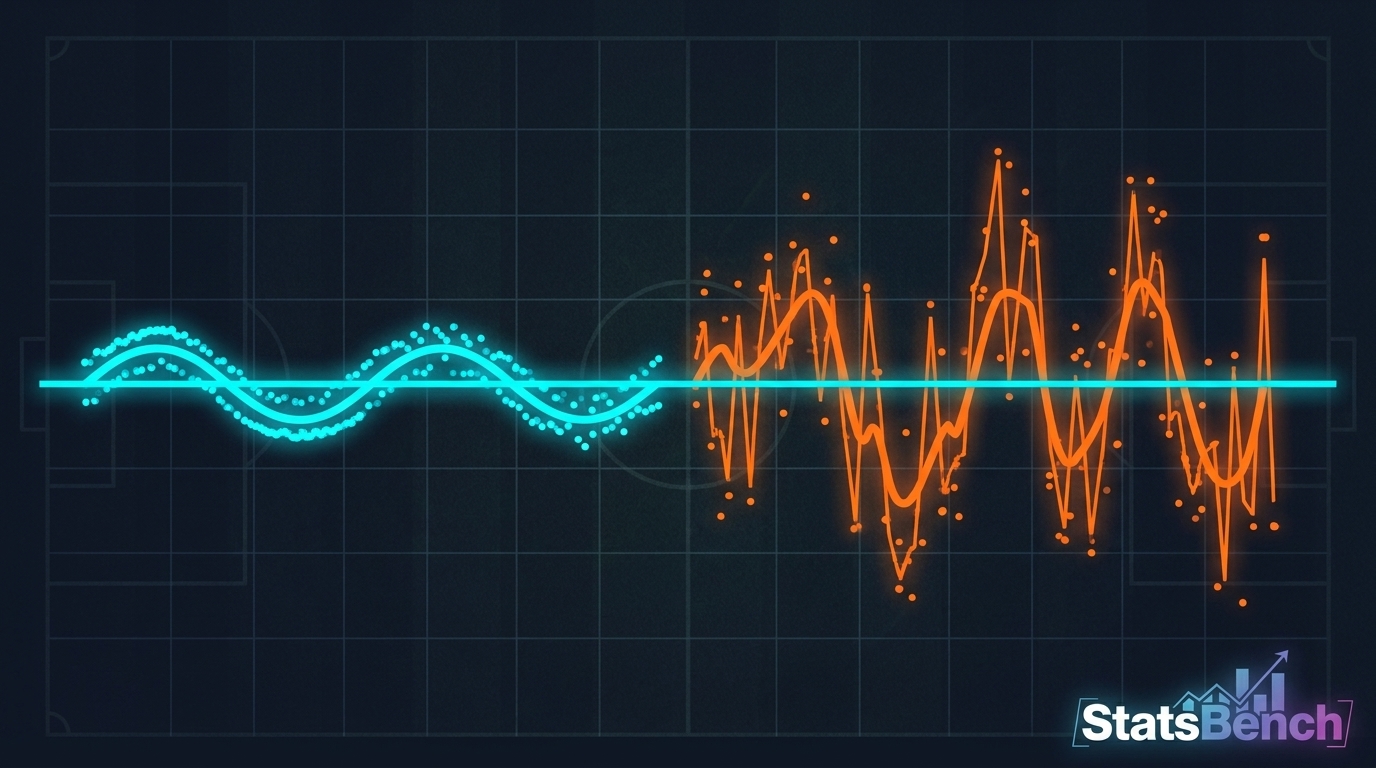
Both measure spread. Standard deviation squares the distances before averaging them, which punishes big outliers harder. MAD treats every deviation equally, so it’s more resistant to one freak game distorting the picture.
| Feature | Mean absolute deviation | Standard deviation |
|---|---|---|
| Math | Average of absolute gaps | Square root of average squared gaps |
| Outlier sensitivity | Lower | Higher |
| Ease by hand | Very easy | Needs a calculator |
| Best for | Small game logs (5-20 games) | Modeling, normal-curve math |
For a 10-game prop log, MAD is usually the better read. One blowout where a starter played 12 minutes can inflate standard deviation and make a steady player look wild. If you want the deeper version, our guide to normal distribution in player props covers how spread feeds into probability, and the z-score explainer shows how to turn spread into a rough hit probability.
You can read more on the underlying math at Wikipedia’s average absolute deviation page.
How to calculate it from a real game log in 4 steps
You need a game log and a calculator. Nothing else.
- Pull 10 to 15 recent games for the exact stat you’re betting. Official league sites work fine, like the game logs on MLB.com or NBA.com.
- Average them. That’s your mean.
- Subtract the mean from each game and drop the minus signs.
- Average those gaps. That’s your MAD.
Then compare the MAD to the gap between the line and the mean. If a player averages 16.8 points, the line is 16.5, and the MAD is 5.5, the line is basically noise. The 0.3 difference is a rounding error next to a 5.5-point typical swing. That prop is close to a coin flip regardless of what the last five games looked like.
Filter for sample quality too. Ten games where the role changed midway is not a clean sample. Our piece on sample size in betting explains how many games you actually need before the number means anything.
What this looks like in real StatsBench prop data
Here’s a dated example. On a StatsBench cheatsheet snapshot from August 12, 2026, a Dallas vs Toronto WNBA game produced several props all sitting at a 60% hit rate over the last 10 games (6 of 10). Same headline hit rate, very different bets underneath.
| Player (WNBA, Aug 12, 2026) | Prop | Hit rate | Best price |
|---|---|---|---|
| Arike Ogunbowale (DAL vs TOR) | Points o/u 16.5 | 60% (6/10) | -110 |
| Arike Ogunbowale (DAL vs TOR) | Assists o/u 3.5 | 60% (6/10) | -107 |
| Azzi Fudd (DAL vs TOR) | Points o/u 11.5 | 60% (6/10) | -125 |
| Azzi Fudd (DAL vs TOR) | Points + rebounds o/u 13.5 | 60% (6/10) | -124 |
| Paige Bueckers (DAL vs TOR) | 3-pointers made o/u 1.5 | 60% (6/10) | -125 |
Look at the 3-pointers line. Made threes are one of the highest-deviation stats in basketball, because the outcome is a handful of low-probability events, not a continuous accumulation. A 6-of-10 hit rate on a threes line carries far more game-to-game swing than a 6-of-10 on a points line.
Identical hit rates can hide wildly different risk. That’s the practical payoff of thinking in deviations.
Note the prices too. Ogunbowale’s assists at -107 and Fudd’s points at -125 are the same 60% historical hit rate at meaningfully different costs. Run both through the implied probability calculator and you’ll see -125 needs roughly 55.6% to break even while -107 needs about 51.7%. Same past performance, different bar to clear.
Which stats have naturally high deviation?
Some markets are volatile by nature. Knowing which ones saves you from treating a coin flip like a trend.
- Very high deviation: home runs, made threes, anytime touchdowns, goals scored. Rare events, huge relative swing.
- Moderate: points, strikeouts, shots on goal, receiving yards. Accumulating stats with real usage floors.
- Lower: minutes, at-bats, pitch counts, snap counts. Volume metrics driven by role, not by outcomes.
Combo props sit in an interesting spot. Adding points and rebounds together usually produces a lower relative deviation than either leg alone, because a bad shooting night often comes with extra rebounds. If that trade-off interests you, we broke it down in the points + rebounds combo props guide.
Turning deviation into a bet-sizing decision
Once you know a player’s typical swing, size accordingly. A high-MAD prop with a thin edge deserves a smaller stake than a low-MAD prop with the same edge, because you’ll wait longer for the math to show up.
That’s a variance argument, not an EV argument. The expected value can be identical while the ride is completely different. Our post on why good bets lose covers the emotional side of that, and the Kelly criterion calculator handles the sizing math.
Two habits that pay off:
- Shop the price on every prop. A -110 instead of -125 on the same bet is free expected value.
- Log the result. Deviation only becomes obvious once you have your own 50-bet sample to look back at.
The free Bet Tracker inside StatsBench does the second one for you, with P&L, ROI and hit rate on any signed-in account.
Where StatsBench does this work for you
Hand-calculating spread for 40 players a night doesn’t scale. StatsBench surfaces Consistency Grades, a 0-100 score per prop, exactly so you can filter for steady producers instead of eyeballing game logs. Prop Finder lets you stack that with hit rate, trend, home/away splits and defensive matchup, then sort for what you want.
The Pro Cheatsheet puts hit rates, consistency and best available price across roughly 60 sportsbooks in one sortable table. That’s the same data behind the August 2026 snapshot above, refreshed continuously.
None of it removes variance. A 60% hit rate over 10 games is a 10-game sample, and 10 games is small. Treat it as a starting filter, not a conclusion.
Bet responsibly
Betting should stay entertainment. Bet only money you can afford to lose, stick to a unit size, and remember that edges show up over hundreds of bets, not five. Must be 21+ where legal. If gambling stops being fun, call 1-800-GAMBLER.
Put the math to work
Averages tell you where a player lives. Deviation tells you how far they wander. Once you check both, a lot of “obvious” props stop looking obvious, which is usually the point.
Want the consistency data pre-computed across every major prop market? Start with StatsBench and filter props by hit rate, consistency and best price instead of building spreadsheets by hand.
]]>
Free preview
See today’s MLB player props on StatsBench
Live lines, last-10 hit rates and the best price across about 60 books. No account needed to look.
Open the MLB player props board →
Prefer email? Get the daily picks newsletter.
Frequently Asked Questions
What is mean absolute deviation?
It’s the average distance between each data point and the mean of the set. You find the mean, measure how far each result sits from it (ignoring the sign), then average those gaps. A small number means consistent results, a large number means volatile ones.
How is mean absolute deviation different from standard deviation?
Standard deviation squares each gap before averaging, so it weights big outliers much more heavily. MAD treats every gap equally and is easier to compute by hand. For short prop game logs of 10 to 15 games, MAD is often the more stable read.
How do I use deviation to pick a side on a prop?
Compare the gap between the line and the player’s average to their typical deviation. If the line sits well below the mean and the deviation is small, the over is much safer. If the line sits above the mean, only a volatile player realistically gets there.
Which player props have the highest deviation?
Rare-event markets swing the most: home runs, made three-pointers, anytime touchdowns and goals. Accumulating stats like points, strikeouts and yards are steadier, and role-based volume stats like minutes or at-bats are steadiest of all.
Does StatsBench calculate consistency automatically?
Yes. StatsBench publishes Consistency Grades, a 0 to 100 score per prop, alongside hit rate and best available price across roughly 60 sportsbooks. You can filter and sort by those fields in Prop Finder and the Pro Cheatsheet.