

What a normal distribution actually tells a prop bettor
A normal distribution calculator takes a mean and a standard deviation, then tells you the probability of landing above or below any number. For player props, that sounds perfect. You know a hitter averages roughly one total base per game, you know how much that bounces around, so you ask the bell curve for the odds of clearing 0.5. The problem is that most prop stats are not shaped like a bell.
That does not make the math useless. It makes it a tool with a narrow job. Used on the right markets, a normal curve gets you within a few percent of the fair price. Used on the wrong ones, it will hand you a 65% number on a bet that hits 45% of the time.
This guide covers where the curve fits, where it fails, and what to check instead. All the example props below come from a real StatsBench cheatsheet snapshot generated on August 5, 2026.
How to use a bell curve to price a prop
The workflow has four steps. You need a mean, a spread, a line, and a way to convert probability into odds.
- Mean: the player’s average in that stat over a defined window (say the last 10 or 15 games in a similar role).
- Standard deviation: how far the typical game strays from that mean.
- Z-score: (line minus mean) divided by standard deviation.
- Tail probability: plug the z-score into a normal distribution table or calculator and read off the area above the line.
Say a WNBA forward averages 32 points plus rebounds with a standard deviation of 6, and the line sits at 29.5. The z-score is about -0.42, which puts the over near 66%. Now compare that to the price. At -115 the book is implying roughly 53%, so the curve says you have a big edge.
Be suspicious of a gap that large. In practice, a 13-point disagreement with a liquid market usually means your inputs are wrong, not that the book fell asleep. We wrote more about reading these charts in our guide to z-scores in betting.
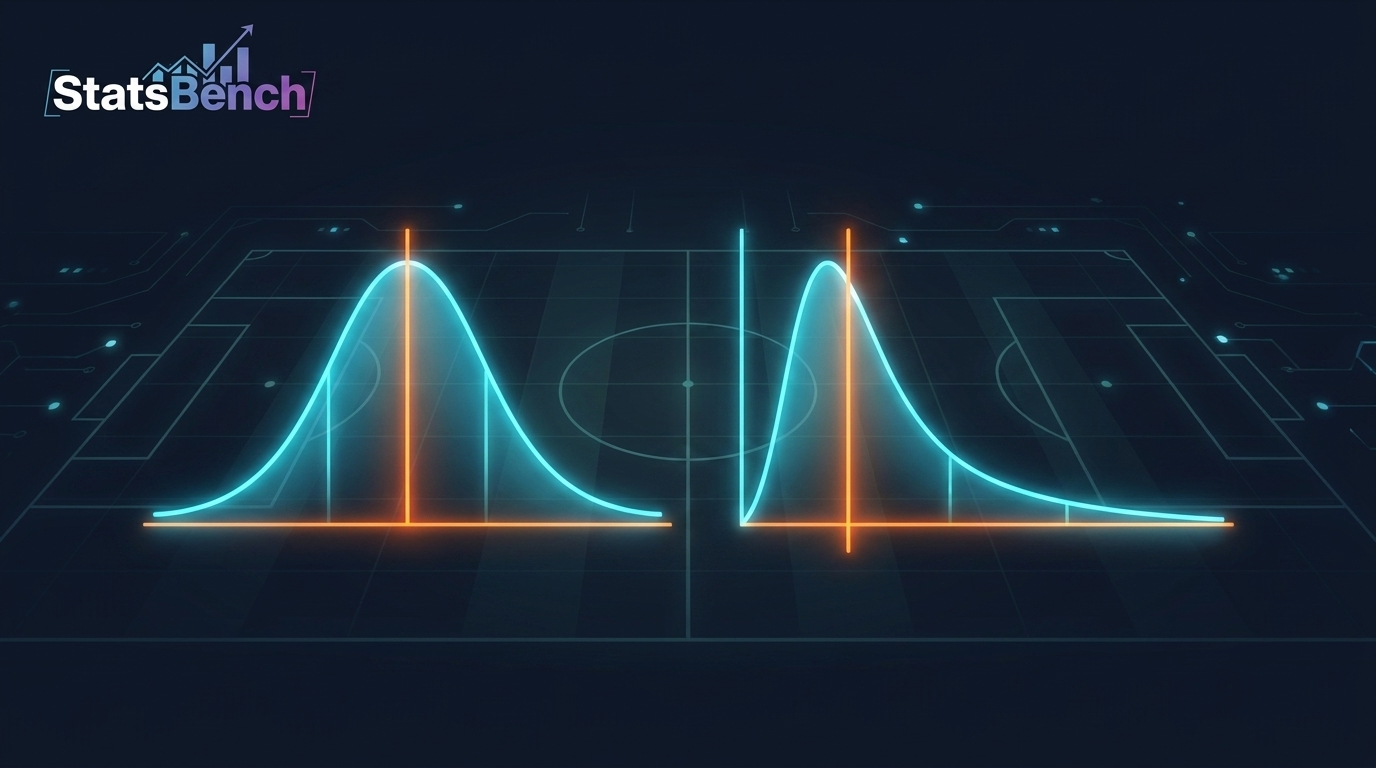
Where the bell curve breaks down
The normal distribution assumes a continuous, symmetric variable with infinite tails. Player stats break all three assumptions.
Counting stats are discrete
A hitter records 0, 1, 2 or 3 hits. Never 1.4. When the line is a low half-number like 0.5 hits, the entire market lives inside two or three possible outcomes. A smooth curve spread over that range is a bad approximation. A Poisson-style approach fits low-count events much better.
Most prop stats are right-skewed
Scoring, kills, shots and total bases all have a floor at zero and a long upper tail. A player can go 5x their average on a hot night. They cannot go negative. That asymmetry means a symmetric curve overstates the downside and understates blowup games.
Playing time is not random noise
A bell curve treats every game as a draw from the same jar. Reality: minutes change, roles change, a starter gets ejected, a pitcher gets pulled after four innings. Those are structural shifts, not variance. Averaging across them inflates your standard deviation and flattens your probabilities toward 50%.
Rule of thumb: the higher the expected count and the more the outcome is a sum of many small events, the better the normal curve behaves.
Which prop markets fit a normal curve best
Combo and volume markets are the friendliest. They add several stats together, and sums of many components trend toward a bell shape (that is the central limit theorem doing its job).
| Market type | Bell-curve fit | Why |
|---|---|---|
| Points + rebounds, PRA, points + assists | Good | High totals, multiple components, symmetric-ish |
| Esports map kills / headshots (double digit lines) | Decent | Many rounds, moderate counts |
| Rebounds only, assists only | Weak | Low counts, skewed |
| Hits, runs, total bases at 0.5 | Bad | Two or three outcomes total |
| Anytime scorer / first basket | Useless | Binary event, not a distribution |
Notice the pattern. Anything with a 0.5 line should be priced as a yes/no probability, not with a curve. Anything in the 20s and 30s is fair game.
Real StatsBench props that show the split
Here are actual rows from the StatsBench cheatsheet snapshot on August 5, 2026. Same headline hit rate, wildly different suitability for a normal-curve estimate.
| Prop | Line | Hit rate | Best price | StatsBench edge |
|---|---|---|---|---|
| Angel Reese (ATL vs PHX) points + rebounds | o/u 29.5 | 60% (6/10) | +112 | -1.4% |
| Alyssa Thomas (PHX @ ATL) points + assists | o/u 23.5 | 60% (6/10) | -115 | 1.2% |
| Allisha Gray (ATL vs PHX) points + assists | o/u 21.5 | 60% (6/10) | -107 | 0.8% |
| Rhyne Howard (ATL vs PHX) rebounds | o/u 3.5 | 60% (6/10) | -105 | 0.3% |
| Vladimir Guerrero Jr. (TOR @ HOU) hits | o/u 0.5 | 60% (6/10) | -250 | 0.5% |
The first three are combo lines in the 20s. A mean-and-spread model has something to chew on there. Reese’s 29.5 points + rebounds is the kind of market where a curve, a decent minutes estimate and a matchup adjustment can produce a usable fair price.
Guerrero at over 0.5 hits is a different animal. The best price in that snapshot was -250, implying about 71%. There is no meaningful bell curve across “0 hits or at least 1 hit.” You need a per-plate-appearance hit probability and an estimate of how many trips he gets. Rhyne Howard’s 3.5 rebounds sits in the awkward middle: low count, skewed, and a curve will be noticeably off.
Key takeaway: every one of those props cleared 6 of 10, yet StatsBench edges range from -1.4% to +1.2%. Hit rate alone does not price a bet. The distribution and the price do.
What to use instead of a normal distribution calculator
You do not need to abandon math. You need to match the model to the stat.
- Low counts (0.5, 1.5, 2.5 lines): Poisson or a simple per-opportunity binomial. Estimate the chance per plate appearance, per shift, per round, then compound it.
- Combo totals in the teens and up: a normal approximation is reasonable, but use a recent, role-adjusted window for the mean.
- Any market you can price two ways: compare your number to the de-vigged consensus from sharp books. If you disagree by more than a few points, audit your inputs first.
- Empirical distributions: instead of assuming a shape, just count. How often did this player clear this exact number in comparable games? That sidesteps the whole shape problem.
That last approach is what a hit rate is. It is crude, but honest. Our piece on why averages lie covers why the shape of the data matters more than the middle of it, and sample size in betting explains how many games you actually need before a hit rate means anything.
Standard deviation is the input people get wrong
Most bad prop models fail on the spread, not the mean. Two mistakes show up constantly.
First, pooling games with different roles. If a player logged 14 minutes off the bench in three of your ten games, those games belong in a different bucket. Including them inflates your standard deviation, which pushes your probability toward a coin flip and makes every line look fairly priced.
Second, ignoring correlation inside combo props. Points and assists are not independent. On a night a guard dominates the ball, both go up together. That correlation widens the real distribution of the sum more than a naive calculation suggests, which matters if you are also building parlays. Our same game parlay correlation guide digs into that.
Also worth remembering: a good model still loses plenty. A 60% prop loses 4 times out of 10, and losing streaks of five or six are routine over a season. That is normal variance, not a broken process.
A quick checklist before you trust a curve
- Is the line above roughly 8 or 10? If not, skip the normal approximation.
- Is the stat a sum of several components? Combos are safer than single stats.
- Did the player’s role stay stable across your sample window?
- Does your fair price land within a few points of the de-vigged market? If not, recheck inputs.
- Are you shopping the number? A -105 versus -120 on the same prop is a real chunk of your edge.
That last one is the least glamorous and the most reliable. In the August 2026 snapshot, Reese’s points + rebounds over showed a best price of +112 while the model edge was slightly negative. Price hunting turns marginal spots into playable ones, and it turns playable spots into good ones.
Where StatsBench fits
StatsBench does not hand you a bell curve. It gives you the two things a curve is trying to approximate: how often a prop has actually hit, and what the market is charging for it across roughly 60 sportsbooks.
The Positive EV Scanner recomputes fair prices from sharp books about every minute, de-vigs them, and flags soft-book prices that sit on the wrong side of that number. The Prop Finder lets you filter by hit rate, consistency grade and SB Score so you can find the stable-role players your model needs. For MLB, the pitcher strikeout tool gives you pitch-mix and opponent whiff data instead of a single blended average.
None of it promises a winner. +EV is a long-run edge that only shows up over a large sample, and every bet still carries real risk. Bet what you can afford to lose, keep it fun, 21+ only. If gambling stops being entertainment, call 1-800-GAMBLER.
Want to skip the spreadsheet work and see which props have both a real hit rate and a mispriced number? Open the Positive EV Scanner and check the current feed against your own read.
Free preview
See today’s MLB player props on StatsBench
Live lines, last-10 hit rates and the best price across about 60 books. No account needed to look.
Open the MLB player props board →
Prefer email? Get the daily picks newsletter.
Frequently Asked Questions
Can you use a normal distribution to price player props?
Sometimes. It works reasonably well for high-total combo markets like points plus rebounds, where the stat is a sum of many small events. It fails badly on low-count props with 0.5 or 1.5 lines, which need a Poisson or per-opportunity approach instead.
What z-score should I calculate for a prop bet?
Take the line, subtract the player’s mean in that stat, then divide by the standard deviation. Feeding that z-score into a normal table gives you the tail probability above or below the line. Compare that probability to the de-vigged market price before you act on it.
Why does my model disagree with the sportsbook by 10 percentage points?
Almost always because of bad inputs, not a soft market. The usual culprits are a mean pulled from games where the player had a different role, or a standard deviation inflated by mixing starts and bench appearances. Audit the sample before assuming you found an edge.
Is a 60% hit rate enough to bet a prop?
Not on its own. Six of ten is a tiny sample, and the price decides whether it is profitable. In the StatsBench snapshot from August 5, 2026, several props all sat at 60% hit rate but ranged from a negative edge to a positive one depending on the odds available.
What is a better model than the bell curve for low-count props?
A Poisson distribution or a simple binomial built on opportunities. For a hitter, estimate the chance of a hit per plate appearance and the expected number of plate appearances. That handles the discrete, zero-floored shape of the data that a normal curve cannot.