
What is a prop finder?
A prop finder is a research tool that scans player prop markets across sportsbooks and sorts them by numbers you actually care about: hit rate, sample size, expected value and the best available price. Instead of scrolling a betting app one player at a time, you filter a whole slate in seconds. The tool does not tell you what to bet. It hands you a shortlist and gets out of the way.
That distinction matters. A picks service sells you an opinion. A research tool sells you a faster way to form your own. The second one survives a bad week, because you can see exactly why a line was on your list.
Below: how these tools work under the hood, what separates a good one from a glorified stat table, and how to read the output without lying to yourself about what the numbers mean.
How does a prop search tool actually work?
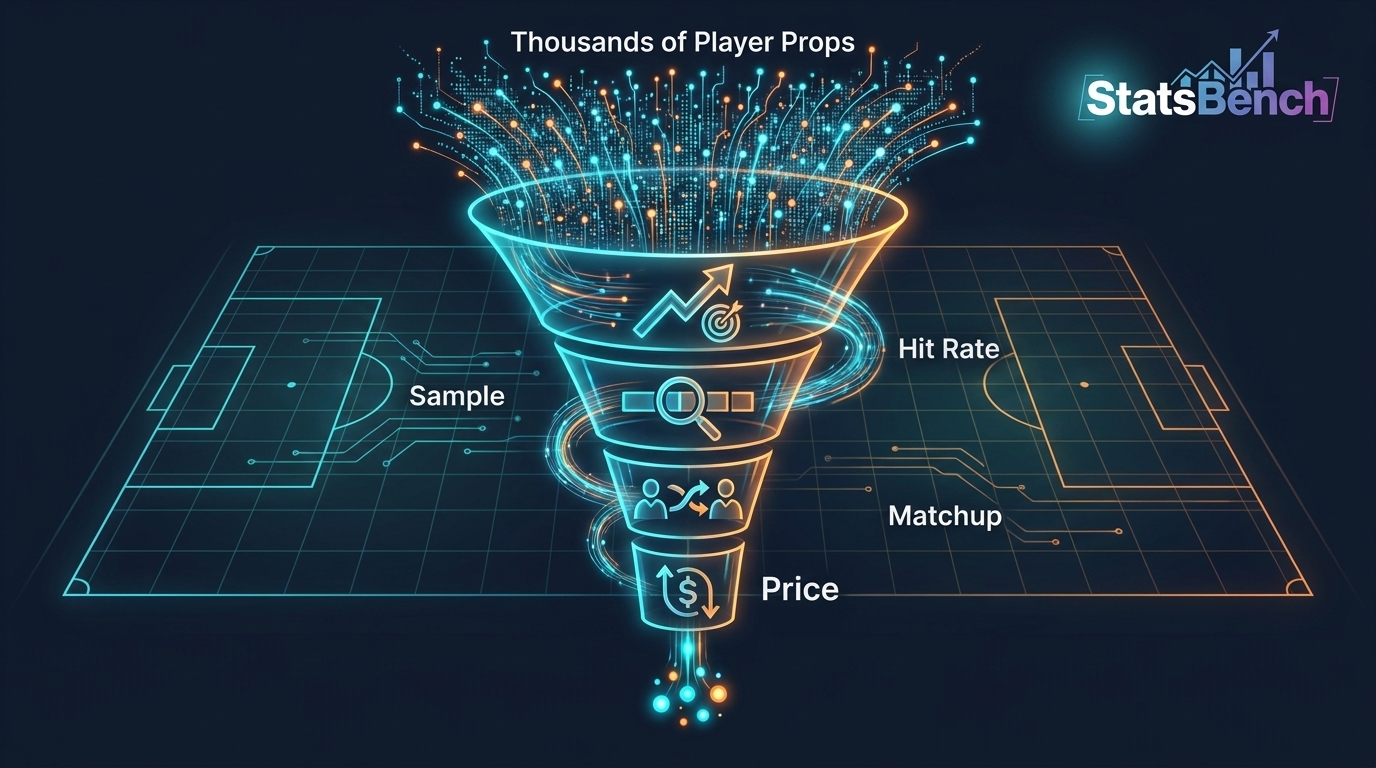
Every serious tool runs the same four steps. The quality differences show up in how well each step is done.
- Ingest. Pull player props and odds from many sportsbooks, plus historical game logs for each player.
- Score. Calculate how often a player has cleared each line over recent samples, how consistent those results were, and how the current price compares to a fair price.
- Filter. Let you slice by stat type, hit rate range, matchup, home/away, rest and more.
- Price. Show the best number across books so you’re not betting -125 when -110 exists elsewhere.
StatsBench tracks roughly 60 sportsbooks and exchanges, including FanDuel, DraftKings, BetMGM, Caesars, bet365 and Pinnacle, plus prediction markets like Kalshi and Polymarket. The Prop Finder lets you filter props from 0 to 100% on SB Score, EV%, hit rate, consistency, trend, home/away, back-to-backs and defensive matchup, then save the filter so you’re not rebuilding it every night.
Where the odds comparison earns its keep
Line shopping is the least glamorous part of this and the easiest money. Two books rarely price the same prop identically. A half-point on a rebounds line or 15 cents of juice compounds over hundreds of bets.
If a tool shows you a hit rate but not the best price, it’s doing half the job. Price is where a marginal bet becomes a good one.
What should a good prop betting tool show you?
Five columns do most of the work. If a tool is missing two of them, keep looking.
| Data point | What it tells you | Trap to avoid |
|---|---|---|
| Hit rate | How often the player cleared this line historically | 6/10 is not a trend, it’s noise |
| Sample size | How many games back the rate covers | Short samples flatter hot players |
| Edge / EV% | Price vs. estimated fair price | Tiny edges vanish with vig changes |
| Consistency | How tightly results cluster around the line | High average, wild spread = coin flip |
| Best odds | Which book pays most for the same bet | Ignoring it quietly costs you CLV |
Consistency deserves a note. Two players can both average 16 points. One scores 14 to 18 every night; the other alternates 6 and 26. Against a 15.5 line, those are completely different bets. StatsBench surfaces this as a 0-100 Consistency Grade you can filter on.
For a deeper read on what these numbers mean in isolation, our guide to what a 60% hit rate really means is the best starting point.
Reading real output: a dated snapshot
Here’s what a filtered board actually looks like. These rows come from the StatsBench cheatsheet on a WNBA slate dated August 29, 2026 (Liberty vs. Sky). Every one of them cleared the 60% hit-rate filter over a 10-game sample.
| Player | Prop | Hit rate | Edge | Best price |
|---|---|---|---|---|
| Jonquel Jones | Points o/u 14.5 | 60% (6/10) | 1.0% | -106 |
| Leonie Fiebich | Pts+Reb o/u 13.5 | 60% (6/10) | 1.6% | -110 |
| Sabrina Ionescu | Assists o/u 4.5 | 60% (6/10) | 1.2% | -141 |
| Jonquel Jones | Pts+Ast o/u 17.5 | 60% (6/10) | 0.7% | -114 |
| Sabrina Ionescu | Pts+Reb o/u 19.5 | 60% (6/10) | 0.1% | -125 |
Notice what the table does not say. It does not say these are winners. Identical hit rates, wildly different prices, and edges ranging from basically nothing to modest.
The Fiebich row and the Ionescu points+rebounds row have the same 6-of-10 record, but one is priced at -110 with a 1.6% edge and the other at -125 with 0.1%. Same “trend,” very different bet. That gap is the entire argument for using a tool that shows edge and price next to hit rate instead of hit rate alone.
Also worth saying plainly: 6 of 10 is a small sample. It’s a starting filter, not a conclusion. Our piece on sample size in betting walks through how many games you actually need before a rate means anything.
Prop finder app vs. spreadsheet: is the subscription worth it?
You can absolutely build this yourself. Pull game logs, calculate rolling hit rates, check a few books manually. Plenty of sharp bettors started exactly there.
The problem is scale and speed. Doing that across every major stat type, for every player on a full slate, across dozens of books, before lines move, is not a spreadsheet job. It’s an ingestion job.
- Spreadsheet: free, fully transparent, slow, breaks when a data source changes format.
- Tool: costs money, saves hours nightly, covers books you’d never check by hand.
StatsBench runs $19.99/mo for Premium and $34.99/mo for Pro, with 20% off yearly plans. Yearly comes to $199 and $299 respectively. Free accounts get the Sharps feed and Bet Tracker, so you can test the workflow before paying anything.
Honest framing: no tool guarantees a profit. What it buys you is time and coverage. Whether that converts into results depends on your discipline and a sample long enough for the math to show up.
Looking for a props.cash or PickFinder alternative?
Bettors shopping around usually want three things the incumbent didn’t give them: broader book coverage for price comparison, a consistency metric alongside raw hit rate, and filters they can save. Ask any candidate tool those three questions directly.
Then ask a fourth: does it publish its method? A tool that explains how it de-vigs and where its odds come from is one you can audit. One that just shows a green checkmark is asking for faith.
Sport-specific tools beat generic ones
Props are not interchangeable across sports. A basketball minutes projection has nothing in common with a pitcher’s whiff rate.
- MLB: the pitcher strikeout tool aggregates pitch mix, opponent K-vulnerability by pitch and handedness, and L5/L15/L30 form. It’s a stats aggregator, not a projection. There’s a companion home run page too.
- NBA/WNBA: Defensive Rankings vs Position show which teams struggle against specific spots on the floor.
- NBA: the First Basket model runs two stages (tip-off winner, then player likelihood). It backtested at a 17.7% first-basket hit rate over 724 games in 2024-25.
Prop coverage runs about 22 NBA prop types, roughly 18 for the WNBA, around 10 batter and 6 pitcher markets for MLB, plus NFL, NHL and soccer. Official league stat pages like NBA.com/stats and MLB.com are worth keeping open as a sanity check on any tool’s numbers.
How to use a shortlist without fooling yourself
A filtered list is the start of research, not the end. Here’s the workflow that keeps you honest.
- Filter wide, then cut. Set a hit-rate floor and a minimum sample. Anything under your sample threshold gets dropped, no exceptions.
- Check the why. Did usage change? Is a teammate out? A 60% rate built on games a starter missed is a different stat.
- Compare the price. Take the best number. Fifteen cents of juice is real money over a season.
- Size it. Flat units or a fraction of Kelly. Never scale up because a bet “feels” safer.
- Log it. Track every bet with closing line, not just win/loss. Beating the close is the earliest honest signal you’re doing something right.
Run the math yourself where it matters. The EV calculator converts a probability estimate and a price into expected value, the de-vig tool strips the book’s margin out of a two-way market, and the Kelly calculator tells you how much to actually risk. All free, no account needed.
If you want the conceptual background first, read hit rate vs. edge and why good bets lose. Those two ideas together explain most of what confuses new prop bettors.
The honest limits
No scanner predicts injuries, ejections, blowouts or a coach deciding to rest a starter in the third quarter. Historical hit rates describe the past. Markets price the future, usually pretty well.
Expected value is a long-run concept. You can bet a genuine edge and lose for weeks. That’s variance, not evidence the process failed. The only defense is a sample large enough to matter and stakes small enough to survive it.
Bet within your means, treat it as entertainment, and stay 21+ where legal. If it stops being fun, call 1-800-GAMBLER. Legality varies by state and country, so check your own rules.
Start filtering instead of scrolling
The gap between a casual bettor and a disciplined one is rarely talent. It’s process. One scrolls a betting app looking for a name they recognize. The other filters a slate on hit rate, sample, consistency and price, then checks the best number before clicking.
Build the second habit. Open the StatsBench Prop Finder, set a hit-rate floor and a minimum sample, save the filter, and see what survives on tonight’s board.
Free preview
See today’s MLB player props on StatsBench
Live lines, last-10 hit rates and the best price across about 60 books. No account needed to look.
Open the MLB player props board →
Prefer email? Get the daily picks newsletter.
Frequently Asked Questions
What is a prop finder?
It’s a research tool that scans player prop markets and sorts them by hit rate, sample size, edge and best available price. It replaces manually scrolling a sportsbook app player by player. It gives you a shortlist to research, not a set of picks.
Is there a free prop betting tool?
StatsBench has a free tier that includes a filtered cheatsheet, the Sharps feed and the Bet Tracker with any account. The free calculators (EV, de-vig, Kelly, parlay) need no account at all. Full filtering across roughly 60 books sits behind the paid plans.
What hit rate should I filter for?
Anything above about 55% is worth a look, but the rate alone is not enough. Pair it with a minimum sample size and check the price, since a 60% prop at -145 can be worse than a 55% prop at -105. Short samples like 6 of 10 are a starting filter, not proof.
Do prop betting tools guarantee profit?
No, and any tool claiming otherwise is selling you something. A good tool improves your research speed and coverage, which improves decision quality over time. Results still depend on discipline, bet sizing and a long enough sample for variance to average out.
Why does line shopping matter so much for props?
Prop markets are less efficient than sides and totals, so prices differ meaningfully between books. Taking -110 instead of -125 on the same bet compounds across a season. A tool that shows the best price across many books captures that automatically.