
Start with the question, not the numbers
Knowing how to read a player stats page starts with one habit: decide what you’re trying to answer before you look. A stats page is a wall of averages, and averages hide almost everything a prop bettor needs. The line is 14.5 points. The question isn’t “is he good?” It’s “how often does he go over 14.5, and why?”
So work backwards from the prop. Pick the stat, pick the number, then hunt for the splits that change that number. Everything else on the page is noise for today.
Season averages set the baseline. Splits, role and matchup set the price.
The five sections that actually matter
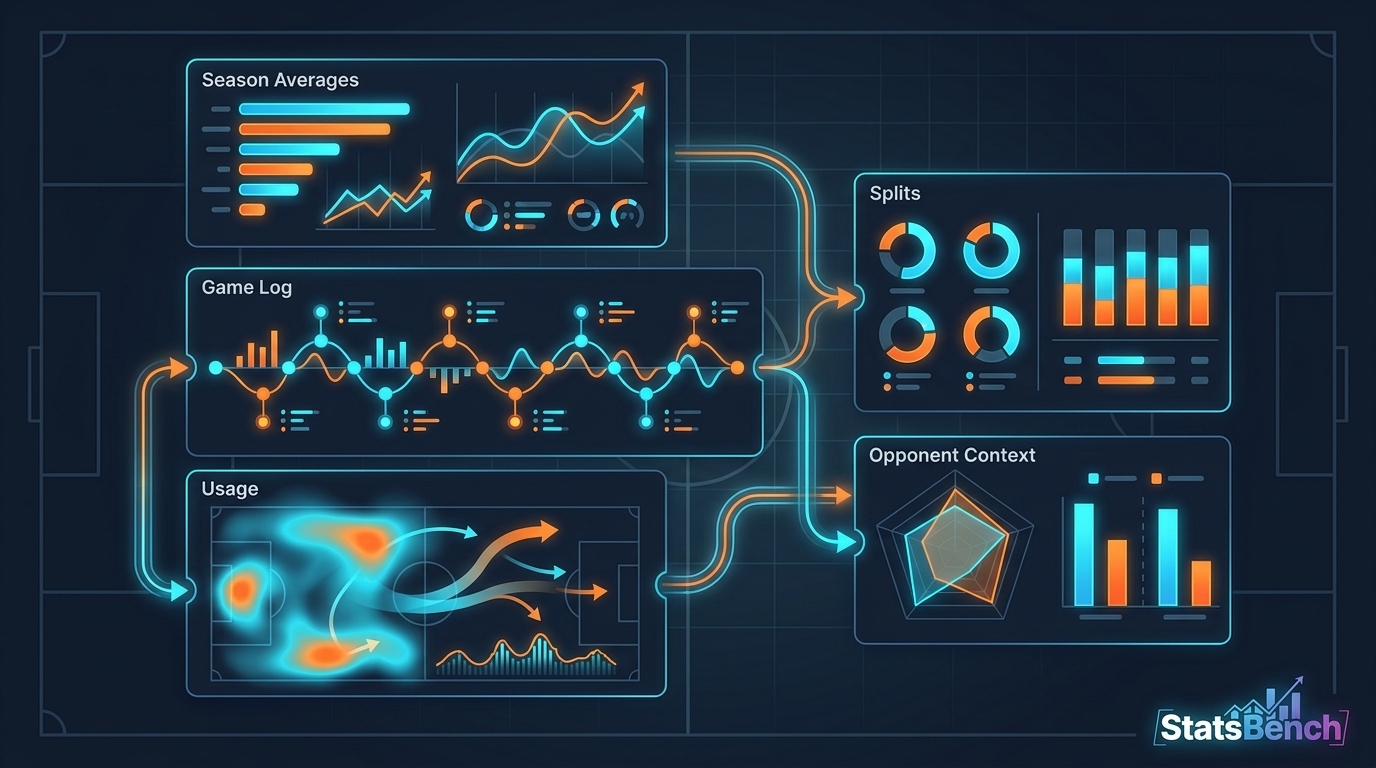
Most stats pages, whether it’s an official league site or a research tool, hold the same five buckets. Here’s what each one is good for and where it lies to you.
- Season averages – your baseline. Useful, but blended across injuries, blowouts and role changes.
- Game log – the raw truth. This is where you count overs and unders yourself.
- Splits – home/away, rest days, opponent quality. This is where real edges hide.
- Usage and role – minutes, touches, batting order spot, power play time. Volume drives props.
- Opponent context – defensive rank versus position, pitcher handedness, pace.
If you only have five minutes, spend three on the game log and two on role. That order beats reading the top-of-page averages ten times over.
How do you turn a game log into a hit rate?
Count. That’s it. Take the last 10 games, mark each one over or under the current line, and divide. A 6-of-10 log against a 14.5 line is a 60% hit rate over that sample.
Two rules keep this honest. First, always count against today’s line, not last month’s. Second, note the games you should throw out: a 12-minute night from an ejection or an early exit isn’t a data point about ability, it’s a data point about chaos.
Ten games is a small sample. One flip changes 60% to 50%. We wrote about that gap in detail in our guide to sample size in betting, and it’s worth reading before you trust any short log.
Watch for the shape, not just the count
Six overs by a hair is very different from six overs by double digits. Scan the margins. If a player clears 14.5 with scores of 15, 15, 16, 16, 17 and 24, that line is priced almost exactly right and the “60%” is fragile.
Consistent producers with tight game-to-game spread are the ones worth paying juice for. Boom-or-bust guys are better plays on alternate lines or unders.
Splits: where the page stops lying
Splits break the average into situations. A hitter’s overall line means little once you separate versus lefties and versus righties. A guard’s rebound number changes when the team plays small.
The splits that move props most often:
| Sport | Split to check first | Why it matters |
|---|---|---|
| Basketball | Minutes with/without a teammate out | Usage spikes when a primary option sits |
| Baseball | vs LHP / vs RHP, batting order spot | Handedness and plate appearances drive volume |
| Hockey | Power play unit, ice time | Shots and points cluster on PP1 |
| Football | Route participation, red zone share | Opportunity, not talent, decides props |
| Esports | Map pool, role, side start | Kill counts swing hard by map and agent/champ |
Official league sites are the cleanest source for the raw split. NBA.com/stats and MLB.com/stats both let you filter by opponent, home/away and date range for free.
Read usage before you read production
Production is a result. Usage is the input, and inputs are more stable. A player who suddenly scores 24 might have had a hot night, or he might have jumped from 24 to 33 minutes. Only one of those repeats.
Check three things: minutes trend over the last five games, share of team touches, and any role note (starting, coming off the bench, moved up the order). Our breakdown of NBA usage rate covers how to spot a role change before the line adjusts.
Bench roles deserve their own read. A backup’s stat page looks terrible on averages and fine on per-minute rates. If you bet those, start with our guide to bench stats.
What real StatsBench prop rows look like
Here’s the practical version. These are actual rows from a StatsBench cheatsheet snapshot dated August 29, 2026, from a WNBA Liberty vs Sky game. Note how the hit rate and the edge tell different stories.
| Player | Prop | Hit rate | Edge | Best price |
|---|---|---|---|---|
| Jonquel Jones | Points o/u 14.5 | 60% (6/10) | 1.0% | -106 |
| Jonquel Jones | Pts+Ast o/u 17.5 | 60% (6/10) | 0.7% | -114 |
| Sabrina Ionescu | Assists o/u 4.5 | 60% (6/10) | 1.2% | -141 |
| Leonie Fiebich | Pts+Reb o/u 13.5 | 60% (6/10) | 1.6% | -110 |
Every row shows the same 60% hit rate. The prices don’t match at all. Ionescu’s assists at -141 need roughly a 58.5% win rate just to break even, so a 60% log leaves almost nothing. Fiebich’s line at -110 needs about 52.4%, which is why its edge reads higher despite identical hit rates.
That’s the whole lesson: a hit rate without a price is not an edge. Run the numbers yourself with the implied probability calculator, then compare to your count from the game log.
Cross-check the price before you bet
A stats page tells you what a player does. It says nothing about whether the number in front of you is fair. Those are two different jobs.
Books disagree on the same prop constantly. The “best -106” in that table exists because StatsBench compares prices across roughly 60 sportsbooks. Taking -120 on a prop you could get at -106 is a real cost, repeated every bet, and it compounds faster than most people believe.
Before you fire, do three quick checks:
- Convert the odds to a break-even percentage.
- Compare that to your game-log hit rate, adjusted for the matchup.
- Shop for the best available number.
The EV calculator handles step one and two together if you’d rather not do it on paper.
Common mistakes when reading stats pages
Most bad prop bets come from reading the page correctly and interpreting it badly. A few repeat offenders:
- Last 10 worship. Ten games is noisy, and a hot stretch usually regresses. See our take on why “last 10 games” is a trap.
- Ignoring blowouts. Garbage time cuts starters’ minutes and inflates backups’.
- Treating combo props as one stat. Points+rebounds+assists has three different failure modes.
- Reading averages during an injury absence. The season number includes games that no longer describe the role.
- Skipping the opponent. Defensive rank versus position changes a projection more than a two-game hot streak does.
A repeatable 6-step read
Use this every time and the process takes about four minutes per prop.
- Write down the exact line and the price.
- Convert the price to break-even probability.
- Count the game log against that exact line.
- Check minutes/role trend over the last five games.
- Check the opponent split (handedness, defensive rank, pace).
- Shop the number across books before betting.
If steps 3 through 5 all point the same direction and step 2 says you’re getting a fair price, you have a bet. If they conflict, pass. Passing is free.
Where to do this faster
Doing all of that by hand for one prop is fine. Doing it for a full slate is a spreadsheet project. That’s what StatsBench compresses: hit rates, consistency grades, matchup context and best available price across ~60 books, in one sortable table.
The WNBA props preview and the MLB strikeout tool are good places to see the format. If you want the full workflow, the player props stats guide walks through which numbers to trust first.
One honest note: none of this makes an outcome certain. Hit rates describe the past, edges are long-run math, and variance will bury a good process for weeks at a time. Bet within your means, treat it as entertainment, and keep it 21+. If gambling stops being fun, call 1-800-GAMBLER.
Ready to stop building spreadsheets? Open the StatsBench Prop Finder and filter props by hit rate, consistency and best price in one pass.
Free preview
See today’s MLB player props on StatsBench
Live lines, last-10 hit rates and the best price across about 60 books. No account needed to look.
Open the MLB player props board →
Prefer email? Get the daily picks newsletter.
Frequently Asked Questions
What should I look at first on a player stats page?
Start with the game log, not the season averages. Count how many of the last 10 games cleared today’s exact line. Then check minutes or role trend, because volume is what makes a prop repeatable.
Is a 60% hit rate a good prop bet?
Only if the price supports it. At -110 you need about 52.4% to break even, so 60% looks strong. At -141 you need roughly 58.5%, which leaves almost no margin on a 10-game sample.
How many games should I use when reading splits?
Ten games is the common default, but it is noisy. Use the last 10 for form and a larger season-long split for the underlying rate, then see where the two disagree.
Do official league stats pages have everything I need?
They have the raw stats and splits, and they are free. What they do not have is the betting line, the price across books, or the break-even math, so you still need a separate step for the odds.
Why do averages mislead prop bettors?
An average blends injury games, blowouts and role changes into one number. Props settle on single games, so the distribution and the current role matter far more than the season mean.