

The best player prop research tools in 2026 all do one of three jobs: show you how often a player clears a number, show you which book prices it worst, or do the expected-value math for you. Almost nobody does all three equally well. This is an honest breakdown of what each major tool is actually good at, so you can stop paying for overlap.
Fair warning up front: we build one of these tools. We’ll be specific about where the others are stronger, because you’ll figure it out in a week anyway.
What do prop research tools actually do?
A prop research tool takes player-prop markets from sportsbooks and attaches context to them. That context is usually hit rates over recent samples, matchup splits, projections, or a price comparison across books. You still decide what to bet.
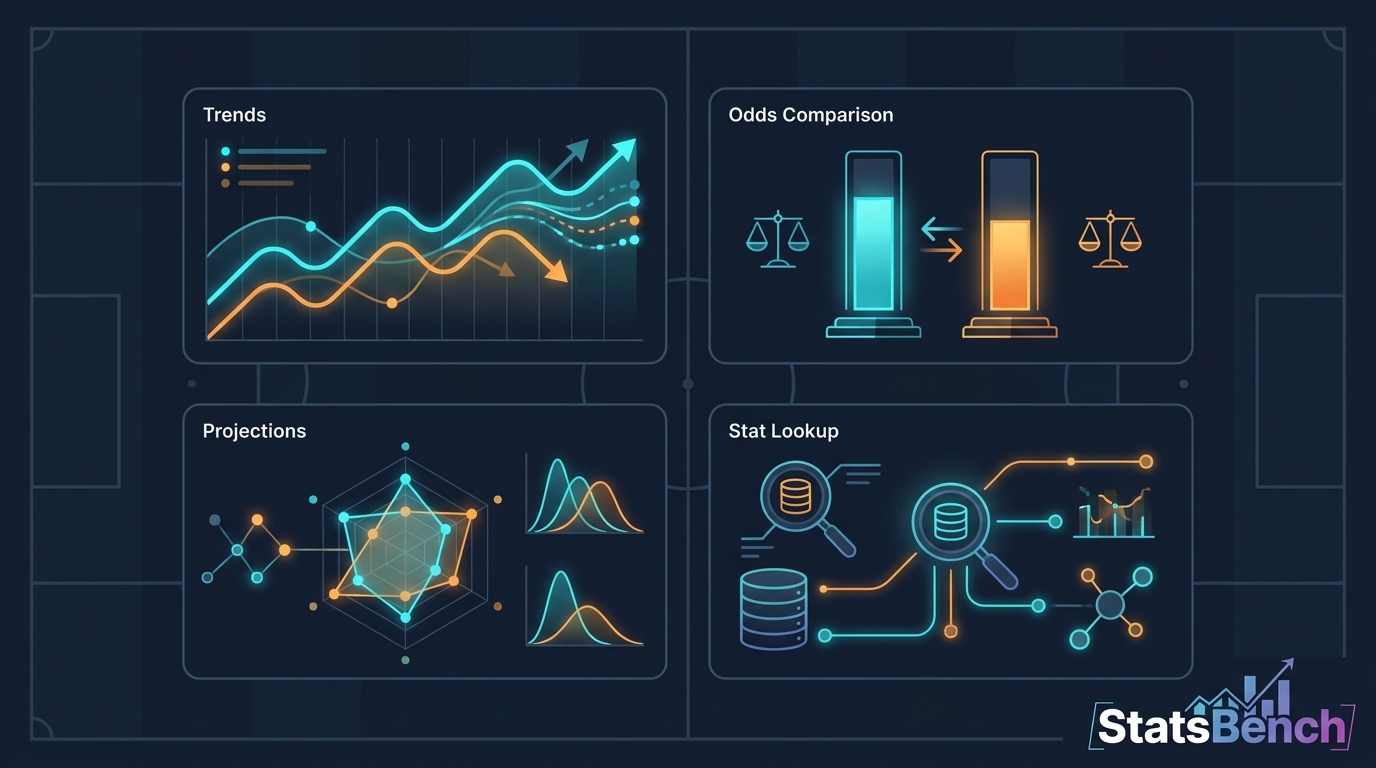
In practice, the category splits into four buckets:
- Trend and hit-rate tools. How often has this player gone over 17.5 points in his last 10, at home, against this defense?
- Odds and +EV tools. Which of ~60 books is off the sharp consensus, and by how much?
- Projection tools. A model output (“we project 18.4 points”) you compare to the line.
- Stat lookup tools. Fast answers to plain-English stat questions, no betting layer.
Most serious bettors end up wanting at least two of those buckets. That’s the whole reason the comparison below exists.
Comparison table: the main options in 2026
Pricing here is deliberately vague (free, freemium, paid). Competitor prices change and we’re not going to keep a stale number on this page.
| Tool | Best for | Free tier |
|---|---|---|
| Props.Cash | Trend visualization and matchup splits | Paid, no free trial |
| Outlier | Odds comparison and finding +EV props on mobile | Free trial, then paid |
| OddsJam | Arbitrage and deep line shopping | Limited free / paid |
| StatMuse | Fast natural-language stat lookups | Free |
| FantasyLabs | DFS-style projections and correlation tools | Paid |
| Stokastic | Simulation-based projections, DFS crossover | Freemium |
| BettingPros | Consensus projections and expert aggregation | Freemium |
| StatsBench | All-in-one: hit rates, defense vs position, odds comparison | Freemium |
Props.Cash: best for trend visualization
If your process starts with “how often does he hit this,” Props.Cash is the cleanest way to see it. The splits interface is genuinely good: last 5, last 10, home/away, versus opponent, with or without a teammate. You can build a case for a prop in about thirty seconds. There’s no free trial, so you’re subscribing before you’ve clicked around.
Where it’s weaker is the money side. Trends tell you what happened, not whether the current price is fair. A 70% hit rate at -260 is a bad bet, and a splits screen won’t stop you from taking it. Pair it with something that prices the market.
It’s also worth remembering that a “hit rate” over ten games is a small sample. We wrote about that in sample size in betting, and it applies to every tool on this list.
Outlier: best for mobile +EV hunting
Outlier built the friendliest mobile experience in the category. It surfaces prop odds across books, flags where the price looks off, and layers in player trends without drowning you in tables. If you bet from your phone between innings, it fits. There’s a free trial, so you can test the workflow before paying.
The trade-off is depth. Fast, opinionated interfaces hide assumptions. You often can’t see exactly which books formed the fair-price baseline, and that matters when you’re deciding whether an edge is real or an artifact of a stale line.
OddsJam: best for arbitrage and line shopping
OddsJam is the heavyweight for pure odds coverage. Arbitrage scanning, middling, and book-by-book comparison are its core, and it covers a very wide set of markets. If your edge is speed and account access across many books, that’s the lane.
It’s less of a “study the player” tool. You’ll get the price, not much of the story behind it. Bettors who like context (usage, defensive matchup, recent role change) tend to run something else alongside it.
StatMuse: best free stat lookup
StatMuse isn’t a betting tool at all, which is exactly why it’s useful. Ask it a question in plain English and it answers with real stats. No line, no edge, no cost. For settling a “has he ever done this on the road” question mid-research, it’s unbeatable.
Just don’t confuse it with a research workflow. There’s no odds layer and no probability math. Use it as a fact-checker for the tools that do have one. For official numbers you can also go straight to the source at MLB.com or WNBA.com.
FantasyLabs, Stokastic and BettingPros: the projection crowd
These three come at props from the DFS side. FantasyLabs is strong on correlation and building lineups with a betting crossover. Stokastic leans on simulations, which is a sound way to think about distributions rather than single-point outcomes. BettingPros aggregates consensus projections and expert opinion into one number.
A projection is only as useful as the distribution behind it. If a model projects 18.4 points and the line is 17.5, the bet’s value depends entirely on how wide the outcomes spread. That’s the difference between a coin flip and a real edge, and it’s why we keep pointing people at why averages lie in prop betting.
These tools are strongest for bettors who already speak DFS. If you don’t, the learning curve is real.
StatsBench: the all-in-one option
Our pitch is coverage in one place rather than being the single best at any one thing. The Prop Finder gives you hit rates, consistency grades, defensive rankings by position and SB Score filters. Odds comparison sits alongside: props show the best available price across sportsbooks, so the trend view and the price check live on one screen.
Coverage runs across 13 leagues (NBA, WNBA, NFL, NHL, MLB plus eight soccer competitions) and three esports titles. The WNBA and esports depth is unusual in this category. Most prop tools treat those as afterthoughts.
What we’re not: a picks service. There’s no “lock of the day,” and we don’t publish a settled-bet ROI, because we’d rather show you the method than a marketing number. The MLB strikeout tool, for example, is a matchup aggregator (pitch mix, whiff rates, opponent K-vulnerability), not a projection engine, and we say so.
What a real snapshot looks like
Here’s a slice of actual StatsBench cheatsheet data from an August 2026 slate, to show the shape of what these tools output:
- WNBA: Shakira Austin (WSH vs ATL) points over/under 17.5, 60% hit rate (6/10), 2.9% edge, best price -117.
- WNBA: Lauren Betts points + rebounds over/under 10.5, 60% (6/10), 1.3% edge, best price -105.
- MLB: Bo Bichette (NYM at PIT) total bases over/under 0.5, 60% (6/10), 1.1% edge, best price -250.
- MLB: Carson Benge hits+runs+RBIs over/under 1.5, 60% (6/10), 0.9% edge, best price -110.
Notice the Bichette line. Same 60% hit rate as the others, but at -250 the price eats nearly all of it. That’s the exact reason a trend-only tool and an odds-only tool each leave money on the table.
How to pick the right tool for you
Start with your actual bottleneck. Most bettors buy the wrong tool because they buy the one with the best marketing, not the one that fixes their weakest step.
- You don’t know what to bet. Start with a hit-rate and matchup tool (Props.Cash, StatsBench Prop Finder).
- You know what to bet but keep getting bad prices. You need line shopping (OddsJam, Outlier, StatsBench best-odds column).
- You want the math done. A +EV scanner is the answer, not more trends.
- You play DFS too. Stokastic or FantasyLabs pull double duty.
- You just want free facts. StatMuse, every time.
One more filter: does the tool show its work? Anything that hands you a number without telling you where it came from is asking for blind trust. Our take on that is in what to look for in a prop bet analyzer.
Are prop research tools worth paying for?
They’re worth it if you bet regularly and your alternative is guessing. The math is simple. A standard -110 prop needs you to win about 52.4% of the time to break even, so shaving even a few cents of vig per bet compounds fast over a season.
They’re not worth it if you bet twice a month for fun. In that case use the free tiers, take the best available price, and enjoy the game.
And no tool removes variance. A 3% edge is a long-run statistical expectation, not a prediction about tonight. You can be right and lose for weeks, which we explain in why good bets lose. Bet only what you can afford to lose, keep it 21+, and call 1-800-GAMBLER if it stops being fun. If the concept of expected value is new to you, read that before you subscribe to anything.
The short version
There’s no single winner. Props.Cash wins on trends, OddsJam on odds breadth, Outlier on mobile speed, StatMuse on free lookups, Stokastic and FantasyLabs on projections, BettingPros on consensus. StatsBench is the option worth trying if you’d rather run one subscription that covers hit rates, matchup data and cross-book price comparison in one place, with real WNBA and esports coverage instead of an afterthought.
Want to see it before deciding? Browse the StatsBench prop finder, compare it against whatever you’re using now, and keep the one that fixes your bottleneck.
Free preview
See today’s MLB player props on StatsBench
Live lines, last-10 hit rates and the best price across about 60 books. No account needed to look.
Open the MLB player props board →
Prefer email? Get the daily picks newsletter.
Frequently Asked Questions
What is the best free prop research tool?
StatMuse is the best genuinely free option for raw stat lookups, since it answers plain-English questions at no cost. For betting context, Props.Cash, Outlier and StatsBench all run freemium tiers with limited but useful access. StatsBench also gives every signed-in user a free Sharps feed and Bet Tracker.
What do player prop research tools actually do?
They attach context to sportsbook prop markets: hit rates over recent samples, matchup and defensive splits, projections, and price comparison across books. Some also compute expected value by comparing a soft book’s price to a sharp-market consensus. None of them place bets or guarantee results.
Are prop research tools worth it?
They’re worth it if you bet often enough that vig and bad pricing add up. A -110 prop needs roughly a 52.4% win rate to break even, so consistently getting the best available price matters. If you bet casually a couple of times a month, free tiers are usually enough.
Can I just use one tool instead of several?
You can, if it covers your bottleneck. Bettors typically need both a context layer (hit rates, matchups) and a pricing layer (odds comparison, EV math). StatsBench bundles the context layer with odds comparison, while specialists like OddsJam or Props.Cash go deeper on one side.
Do these tools guarantee winning bets?
No. A positive expected value bet is a long-run statistical edge, not a prediction about a single game. Variance means you can make good bets and lose for weeks, so bankroll management matters more than any tool. Bet responsibly, 21+, and call 1-800-GAMBLER if you need help.