
Betting statistics are the numbers behind a wager: hit rate, sample size, edge, and how a player or team has actually performed against a specific matchup. On their own, these numbers don’t guarantee anything. But read correctly, they tell you whether a line is fair, generous, or a trap.
Most bettors see a stat like “6 for 10” and stop there. That’s a mistake. A stat is only useful once you understand where it comes from, how big the sample is, and whether it’s a parameter (the true, unknown rate) or a statistic (an estimate from limited data). That distinction sounds academic. In betting, it’s the whole game.
What Are Betting Statistics, Really?
Betting statistics are measurements pulled from real games: how often a player clears a prop line, how a team performs after a back-to-back, how a pitcher’s strikeout rate holds up against a lineup. StatsBench tracks these across player props in the NBA, WNBA, NFL, NHL, MLB, and soccer, then attaches a hit rate and consistency grade to each one.
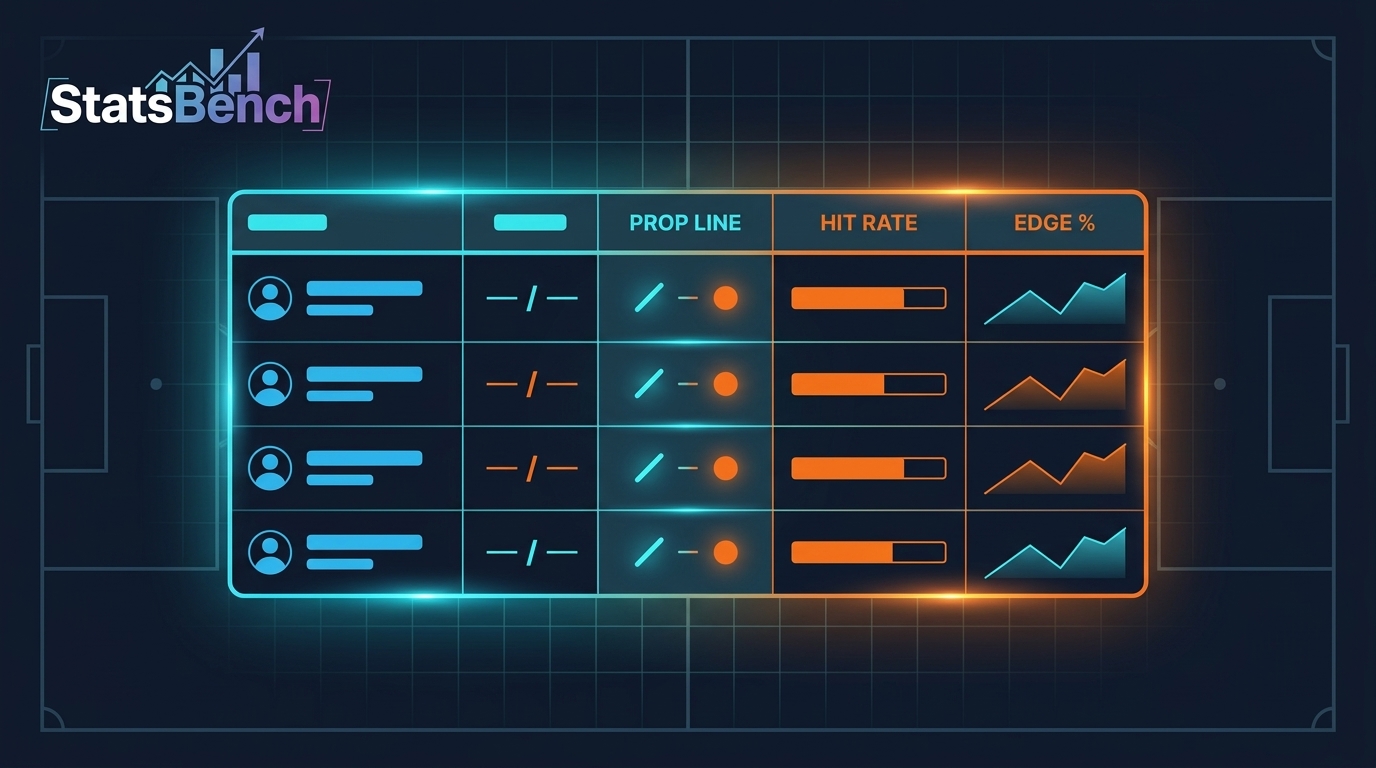
Here’s an example from the current MLB slate. Kody Clemens (MIN vs LAA) is 6-for-10 (60%) on the total bases 1.5 over, with a 1% edge and best price at -110. That’s a real number, drawn from a real sample. It’s useful, but it’s still just an estimate of the true rate, not a guarantee of what happens tonight.
Statistics vs Parameters: What’s the Difference?
A parameter is the actual, fixed truth about a whole population. A statistic is what you calculate from a sample, and it’s your best guess at that parameter. In betting, you never see the parameter. You only ever see statistics, built from however many games happened to occur.
This is the “statistics vs parameters” question that trips up a lot of people outside of betting too, in survey research or lab science. The logic carries over directly: a player’s “true” over/under rate against a given matchup is the parameter. His 6-for-10 mark this month is the statistic estimating it. Bigger samples get you closer to the real number. Small ones can lie to you.
Which Situation Involves Descriptive Statistics?
Any time you’re just summarizing what already happened, without predicting what comes next, you’re using descriptive statistics. A player’s hit rate over his last 10 games is descriptive. It reports the past; it doesn’t forecast the future on its own.
Betting gets interesting when you move from descriptive to inferential thinking, using that past sample to estimate future probability. That’s the entire point of a hit rate column. The number itself is descriptive. What you do with it, deciding if a line is mispriced, is inferential.
How Do You Read a Hit Rate Without Getting Fooled?
You read a hit rate by checking the sample size first, then the context, then the number itself. A 60% hit rate over 10 games is a starting point, not a conclusion. Ten games is a small sample in any sport, and it can swing hard on a couple of unlucky nights.
Look at Natasha Howard (MIN vs NY). Her rebounds over 7.5 is hitting 60% (6/10) with a 1.4% edge at -145 best price. That’s a real, current signal from StatsBench. It becomes more meaningful once you also check her role, minutes trend, and the opponent’s rebounding rank, not just the raw percentage.
- Sample size: 10 games tells you less than 30. 30 tells you less than a full season.
- Context: home vs away, opponent rank, back-to-backs, recent role changes.
- Price: a 60% hit rate at -240 is a different bet than 60% at +100.
- Edge: the gap between the market price and what the data says is fair.
What Is Mu (μ) in Statistics, and Does It Matter for Betting?
Mu (μ) is the standard symbol for a population mean, the true average of something across every game that could ever happen, not just the ones you’ve observed. In betting terms, μ would be a player’s real long-run average for a stat, like true rebounds per game against a given defense.
You never actually get to see μ. You only see x̄ (the sample mean), calculated from the games that have already been played. Every hit rate on a prop sheet is an attempt to approximate μ using a finite x̄. That’s why sample size matters so much: more games narrow the gap between your estimate and the real thing.
Where Does a “Statistics Formula Sheet” Actually Help a Bettor?
A statistics formula sheet (the kind used in AP Stats classes) helps a bettor mainly with two ideas: standard deviation and confidence intervals. Both explain why a hit rate needs room to breathe before you trust it.
Standard deviation tells you how much a stat bounces around its average. A player with wildly inconsistent minutes will have a wide spread, meaning his hit rate on any prop is less trustworthy game to game. StatsBench’s Consistency Grades do this work for you, scoring 0 to 100 how stable a player’s production has been, so you don’t need the formula sheet open next to your bet slip.
How Sportsbooks Use Statistics Differently Than Bettors
Sportsbooks use betting statistics to set an efficient, vig-included price. Bettors use the same underlying numbers to find where that price is wrong. The gap between those two uses is where an edge lives.
Sharp books like Pinnacle move fast and price close to fair. Soft books lag, and that lag is what a positive-EV scan is built to catch. StatsBench’s Positive EV Scanner recomputes fair prices from sharp consensus every minute and flags where a soft book hasn’t caught up yet. It’s not a guarantee of a win on any single bet. It’s a long-run statistical edge, and it only pays off over a real sample, the same idea as μ vs x̄ above.
A Quick Example From Tonight’s MLB Slate
Take Brooks Lee (MIN vs LAA). His hits + runs + RBIs over 1.5 is hitting 60% (6/10), with a 0.5% edge and best price -130. His singles over 0.5 is also 60% (6/10), edge 0.4%, best price -115. Two different props, same player, similar hit rate, different edges.
That’s the practical lesson: the hit rate alone doesn’t tell you which bet is better. The edge, the number StatsBench calculates by comparing the market price to a de-vigged fair price, is what separates a good number from a good bet. A 60% hit rate with no real edge is just a coin that’s landed the same way six times. Ten more flips could look completely different.
Putting It Together: A Simple Checklist
Before trusting any betting statistic, run it through a short checklist. It takes 30 seconds and saves you from betting on noise.
- Is the sample at least 10-15 games? Smaller than that, treat it as a hint, not a signal.
- Is there an actual price edge, or just a high hit rate at bad odds?
- Does the matchup context support the number, or fight against it?
- Would this stat hold up if you shopped it across more than one book?
Line-shopping matters here too. A 60% hit rate prop priced at -240 in one place might sit at -190 somewhere else. That gap is closing line value sitting on the table. The Pro Cheatsheet pulls best available odds across roughly 60 sportsbooks so you’re not stuck with whatever price your usual app shows.
If you bet MLB pitching props specifically, the MLB Strikeout tool works the same way, pitch-mix data, opponent whiff rates by hand, and recent form, all laid out so you can judge the sample yourself rather than trust a single hit-rate number in isolation.
The Bottom Line on Betting Statistics
Good betting statistics don’t predict outcomes. They narrow the range of what’s likely, given real, verifiable samples. Treat every hit rate as an estimate of an unknown true rate, check the sample and the price, and you’ll make sharper decisions than someone chasing a hot streak.
Betting is entertainment, and it should stay fun. Numbers help you make more informed choices, they don’t remove variance. Bet within your means, and if it stops being fun, that’s the signal to step back. If you’re 21+ and want a daily, no-cost look at real hit rates and edges like the ones above, grab the free StatsBench cheatsheet, it’s built to make this exact kind of number-reading faster.
Free preview
See today’s MLB player props on StatsBench
Live lines, last-10 hit rates and the best price across about 60 books. No account needed to look.
Open the MLB player props board →
Prefer email? Get the daily picks newsletter.
Frequently Asked Questions
What are betting statistics used for?
They summarize how a player or team has performed in specific situations, like hitting a prop line or covering a spread. Bettors use them to judge whether a current price is fair or mispriced, not to predict a guaranteed outcome.
Statistics vs parameters: which one do betting stats show?
Betting stats are statistics, estimates calculated from a limited sample of games. The parameter, the true long-run rate, is never directly observable. More games in the sample means the statistic gets closer to the real parameter.
Which situation involves descriptive statistics in betting?
Any hit rate, average, or trend based purely on past games is descriptive statistics. It’s a summary of what already happened, not a forecast, though bettors often use it as the starting point for a forecast.
What is mu (μ) in statistics and why does it matter here?
Mu is the symbol for a population’s true mean. In betting, it represents a player’s real long-run rate on a stat, which you can only estimate from the sample of games actually played, never observe directly.
How many games should be in a sample before I trust a hit rate?
There’s no magic number, but 10 games is a small sample in any sport and can swing on variance. Treat anything under 15 games as a hint worth checking against matchup context, not a conclusion on its own.