

What does extrapolation mean?
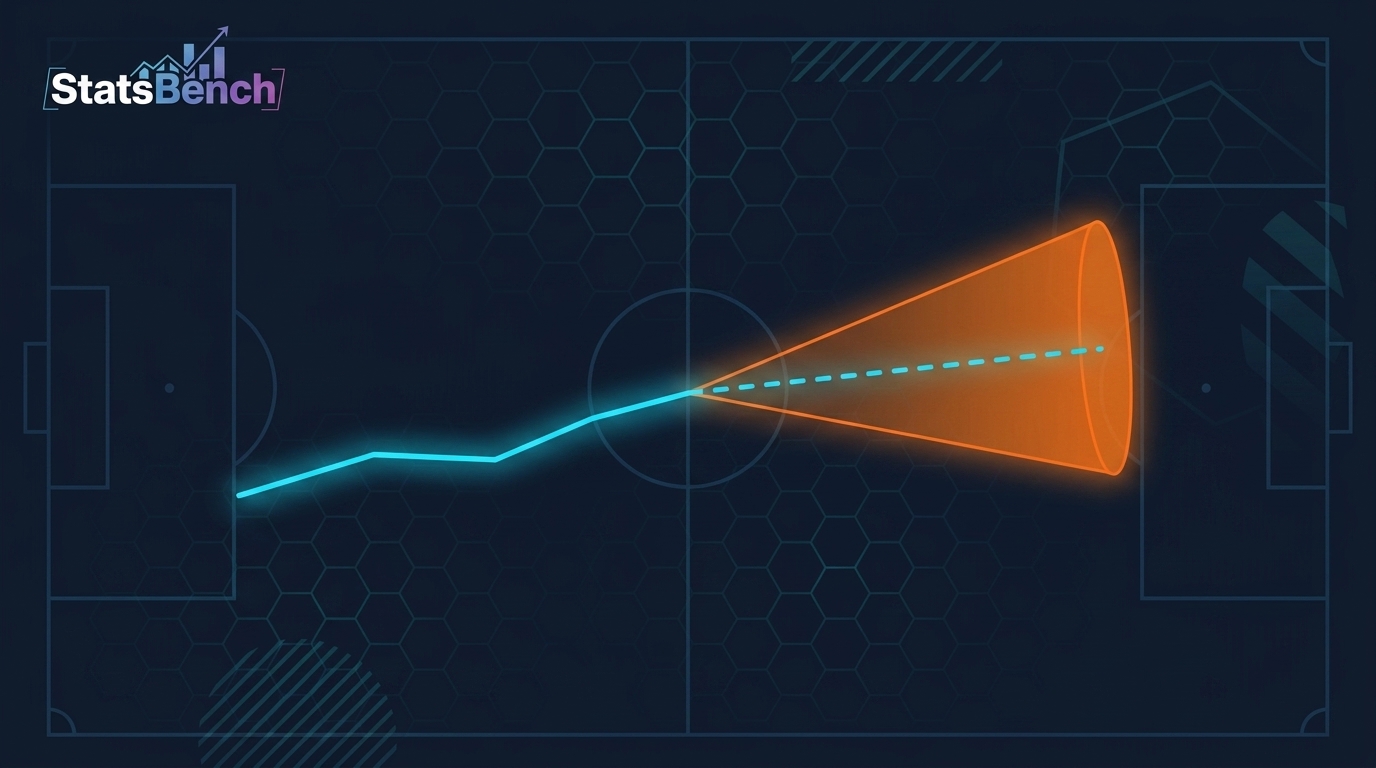
The short version of the extrapolation meaning: you take a pattern you’ve already measured and stretch it beyond the data you have. A hitter has 6 total bases in 10 games, so you assume the next 10 games look about the same. That stretch is the whole idea, and it’s also where bettors get burned.
Interpolation fills in a gap inside your data. Extrapolation pushes outside it. One is fairly safe. The other is a guess wearing a math costume.
Every player prop line you bet is somebody’s extrapolation. A sportsbook looked at past performance and projected it onto tonight. Your job isn’t to avoid projecting forward. It’s to project forward more carefully than the person who set the number.
Why bettors extrapolate whether they mean to or not
You can’t bet on the past. You bet on a game that hasn’t happened. So any prop decision requires stretching known data into unknown territory.
Here’s what that looks like in practice:
- A pitcher has a 30% strikeout rate over five starts, so you expect roughly six Ks in six innings tonight.
- A guard is averaging 4.2 assists since moving into the starting lineup, so you treat that as the new baseline.
- A batter has hit safely in 6 of his last 10, so you price his hits prop near 60%.
All three are reasonable. All three can be badly wrong, because a rate measured over a short window carries a wide margin of error. The general concept is used across science and finance, and the warning is the same everywhere: the further you push past your data, the faster your confidence should shrink.
The three ways extrapolation goes wrong on props
1. The sample is too small to stretch
Ten games is enough to notice something. It isn’t enough to bet the house on. A 60% hit rate over 10 games can easily belong to a true 45% player who ran hot, or a true 70% player who ran cold.
Small samples don’t just produce uncertain estimates. They produce estimates that look confident because the percentage is a clean round number.
2. The trend is linear in your head, not in reality
Players don’t improve in straight lines. Usage jumps, then plateaus. Volume spikes with an injury, then snaps back when the starter returns. If you draw a straight line through three good games, you’ve built a projection that reality has no reason to honor.
3. Conditions changed underneath the numbers
This is the quiet killer. You extrapolate a rate that was earned against weak defenses, in a hitter-friendly park, or in blowouts with garbage-time minutes. The number is real. The context it came from is gone. Our guide on spotting garbage-time risk covers one version of this trap in detail.
How to extrapolate without fooling yourself
Direct answer: shrink your projection toward the long-run average, widen your uncertainty, and check that the conditions behind the data still apply. That’s it. Three habits.
Shrink toward the mean first. If a player’s 10-game rate is far above his season rate, the honest projection sits between the two, usually closer to the season number. This is regression to the mean doing its work, and we broke down the mechanics in this guide to regression. Ignore it and you’ll pay for hot streaks at full price.
Then ask three questions before you fire:
- How many games is this based on? Under 15, treat the rate as a hint, not a projection.
- What produced the rate? Role change, matchup luck, or genuine skill? Only one of those repeats reliably.
- Does the line already price it in? If the book moved, your “discovery” is public information.
Widening your uncertainty is the part most bettors skip. A projection of 6.0 strikeouts with a range of 3 to 9 is a very different bet than 6.0 with a range of 5 to 7. Same point estimate. Totally different edge.
A real example: what a 60% hit rate actually tells you
Here’s live StatsBench cheatsheet data from a July 25, 2026 MLB slate, Royals at Tigers. These are real props with real 10-game hit rates.
| Player | Prop | 10-game hit rate | Edge | Best price |
|---|---|---|---|---|
| Dillon Dingler (DET) | Total bases o0.5 | 60% (6/10) | 1.8% | -235 |
| Dillon Dingler (DET) | Hits + runs + RBIs o0.5 | 60% (6/10) | 1.8% | -325 |
| Dillon Dingler (DET) | Hits o0.5 | 60% (6/10) | 0.6% | -225 |
| Nick Loftin (KC) | Total bases o0.5 | 60% (6/10) | 0.4% | -164 |
| Nick Loftin (KC) | Hits o0.5 | 60% (6/10) | 0.2% | -165 |
| Isaac Collins (KC) | RBIs o0.5 | 60% (6/10) | 0.2% | +230 |
Look at what happens when you stop at the hit rate. Every row says 60%. Six for ten, identical on the surface. A naive projection would treat all six as the same bet.
They aren’t close. The edges range from 0.2% to 1.8%, and the prices range from +230 to -325. Same raw rate, wildly different value, because the market has already priced each situation differently. Per StatsBench data from that slate, Dingler’s total bases prop carried a 1.8% edge at -235 while Loftin’s hits prop showed 0.2% at -165.
The hit rate is your starting point, not your conclusion. Extrapolating 6-of-10 forward and calling it 60% ignores the price, the opponent, and the fact that ten games is a coin-flip-sized sample. Edges that small are also worth naming honestly: a sub-1% edge is thin enough that variance dominates over any short run.
Extrapolation vs. what sportsbooks already know
Books project forward too, with more data and better models. So a simple straight-line projection off recent games rarely beats them. Your edge shows up in three places instead:
- Price. Two books can disagree on the same projection. Shopping across roughly 60 sportsbooks turns identical opinions into different EV.
- Context the market is slow on. Role changes, pitch-mix mismatches, defensive weakness by position.
- Discipline. Passing on a thin number is a skill, not a failure.
That’s roughly how the Positive EV Scanner works. It de-vigs prices from sharp books to get a fair number, then compares that to soft-book lines and recomputes about every minute. No projection of a player’s future is involved in the pricing step, just a comparison of what different markets believe right now.
For prop research, the cheatsheet and Prop Finder let you filter by hit rate, consistency grade, and matchup, so you can see whether a 60% rate came from a steady performer or a volatile one. Consistency Grades exist precisely because two players with the same average can have very different distributions.
Related terms worth knowing
- Interpolation, estimating inside your known range. Safer.
- Regression to the mean, extreme results drift back toward average. The natural brake on aggressive projections.
- Sample size, how much data your estimate rests on. Small samples mean wide error bars.
- Variance, the spread of outcomes. High variance means your point estimate says less.
- Correlation, how two stats move together. Useful, and often misread. See our breakdown of correlation for bettors.
If you want the wider vocabulary in one place, Betting Statistics 101 covers the terms that actually change decisions. For MLB specifically, official rate stats live at MLB.com’s stats hub.
The honest takeaway
Projecting forward is unavoidable. Doing it badly is optional. Shrink extreme rates toward the long-run average, demand a real sample before you trust a percentage, and always check what the price is asking you to believe.
And keep the frame right. A positive edge is a long-run statistical advantage, not a promise about tonight. Short runs are noisy by design. Bet money you can afford to lose, keep it entertainment, 21+ only, and if it stops being fun, call 1-800-GAMBLER.
Want to see hit rates, matchups and best available prices side by side instead of building projections in a spreadsheet? Grab the free player prop cheatsheet. It’s free, it takes about two minutes to scan, and it shows you the context a raw percentage hides.
Free preview
See today’s MLB player props on StatsBench
Live lines, last-10 hit rates and the best price across about 60 books. No account needed to look.
Open the MLB player props board →
Prefer email? Get the daily picks newsletter.
Frequently Asked Questions
What does extrapolation mean in simple terms?
It means taking a pattern from data you already have and projecting it beyond that data. If a player averaged 5 rebounds over 10 games, assuming he gets about 5 tonight is extrapolation. The further you push past the measured range, the less reliable it gets.
What’s the difference between interpolation and extrapolation?
Interpolation estimates a value inside the range you’ve already measured, which is relatively safe. Extrapolation estimates outside that range, which is much riskier. Betting on a future game is always extrapolation.
How many games do you need before a hit rate is useful?
A 10-game window is a hint, not a projection. Sharp bettors want a larger sample plus context on why the rate happened before trusting it. StatsBench shows L5, L15 and L30 windows so you can compare short-term form against a broader baseline.
Does a 60% hit rate mean a prop is a good bet?
Not on its own. Price decides value. In real StatsBench cheatsheet data from a July 25, 2026 MLB slate, six different props all showed 60% (6/10) hit rates but edges ranging from 0.2% to 1.8% at prices from +230 to -325.
Can extrapolation give you an edge over sportsbooks?
Rarely by itself, since books project forward with more data. Your edge usually comes from line shopping across many books, spotting context the market is slow to price, and passing on thin numbers.