
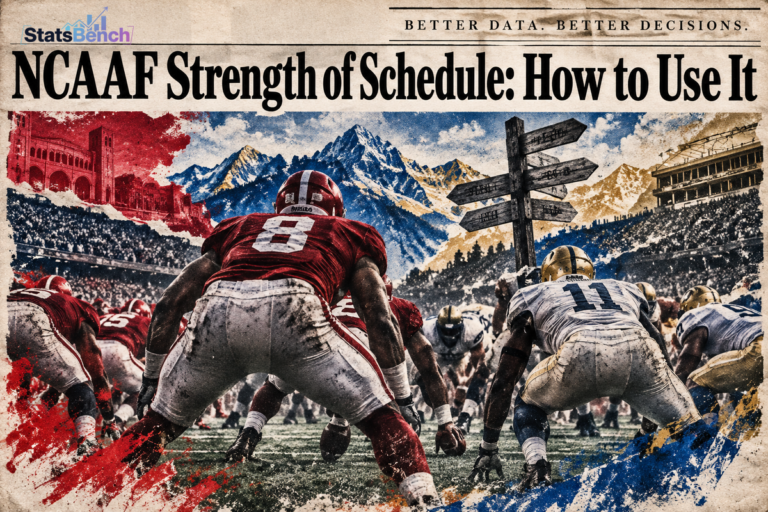
A 9-2 record in the Mountain West and a 9-2 record in the SEC are not the same thing. NCAAF strength of schedule is the number that separates them, and it’s the first thing I check before I touch a spread, a team total, or a season-long prop line.
It’s also the most misused stat in college football handicapping. People quote SOS like it settles an argument. It doesn’t. It just tells you which of a team’s numbers you can trust.
What does strength of schedule mean in college football?
Strength of schedule rates how tough a team’s opponents have been (or will be) compared with everyone else in the country. Basic versions average opponents’ win percentages. Better versions adjust for who those opponents played, then weight it by how efficient those teams were on a per-play basis.
College football needs this adjustment more than any other sport. More than 130 FBS programs play across wildly unequal conferences, plus a handful of games against FCS teams that count on the record but tell you almost nothing. A schedule built on three buy games and a down division can turn an average team into a 10-win story.
That gap is the whole reason the College Football Playoff selection committee publishes its own strength of schedule figures alongside its rankings. They know a raw record hides too much.
How is strength of schedule calculated?
There’s no single agreed-upon formula. Every rating you see (ESPN’s FPI, the old BCS computers, your favorite spreadsheet) builds SOS differently, which is why two sites can disagree by dozens of spots on the same team. Here are the three families of methods worth knowing.
Opponent win percentage
Add up the records of everyone a team has played, divide by games. It’s transparent and easy to compute, and it’s still what most casual SOS talk means.
Its flaw is obvious once conference play starts. Beating a 6-4 team that fattened up on four cupcakes looks identical to beating a 6-4 team that survived a brutal slate. Some models fix this by averaging opponents’ opponents’ records too, which is better but still ignores score margins.
Schedule-adjusted efficiency
This is the version serious bettors use. Take a team’s per-play or per-drive performance, then adjust it for the quality of the defenses and offenses it faced. A rushing attack that averaged 5 yards a carry against three top-30 run defenses is worth more than the same number against three bottom-30 units.
The output isn’t a schedule rank so much as a set of opponent-adjusted ratings. That’s the useful part. You want the adjusted number, not the rank.
Recruiting and talent composites
Team talent rankings measure roster quality, not schedule difficulty. They get mashed together with SOS all the time in preseason content. Talent tells you who should win. SOS tells you what the results meant.
NCAAF Strength of Schedule: How to Read It Without Getting Fooled
The trick is treating SOS as a filter, not a ranking. Ask what a given number is hiding before you let it change your read on a game.
| What you see | What it might mean | What to check |
|---|---|---|
| 9-1 record, close wins | Beat average teams in one-score games | Per-play margin, opponent-adjusted |
| Top-10 total defense | Faced slow, run-heavy offenses | Yards per play, pass vs. rush splits |
| 40 points a game | Two FCS opponents in the sample | Stats with non-FBS games removed |
| SOS rank from August | Built on last season’s records | A fresh number after Week 6 |
Schedule strength tells you which stats to trust, not who wins. A team with a weak slate usually has inflated counting stats, and that shows up in prop lines as much as in sides.
Why preseason SOS numbers go stale
Because they’re built on last year’s results, and college rosters turn over faster than any professional league. A quarterback transfers, both coordinators leave, and the 10-3 opponent on your schedule is suddenly a rebuilding project.
Four things wreck a preseason SOS number by mid-October:
- Transfer portal churn. Skill-position rooms can flip in a single spring.
- Coordinator changes. Tempo and scheme shifts change how many plays a defense faces.
- Quarterback injuries. One ankle can turn a top-20 offense into a punt machine.
- Regression. Teams that won every close game last season usually don’t repeat it.
Practical rule: ignore SOS for the first three weeks, use a blended number through October, and trust the in-season version by November. If a model still leans on August data in Week 10, it’s telling you about last year.
How does schedule strength change ATS handicapping?
It changes which stats you believe, not which side you bet. The market already prices in the fact that one team played a brutal schedule and the other played nobody. Your edge comes from spotting where the public is misreading that gap.
Three patterns repeat every season. A team that covered early against weak opponents gets overrated by the number. A team that got beaten up by three ranked opponents gets undervalued. And a mid-major with a gaudy record against soft competition draws money the moment it faces a real defense.
CFB ATS picks: a schedule-aware checklist
CFB ATS picks get sharper when you strip out opponent quality before comparing two teams. Run this before you bet a side:
- Remove games against FCS and bottom-tier non-conference opponents.
- Compare per-play offense and defense, not points per game.
- Note which unit faced the tougher half of its schedule so far.
- Convert the price you’re getting into an implied probability before deciding it’s a bargain. The free implied probability calculator does that in one step, and it’s the fastest way to see how much vig you’re paying for a popular side.
Sides and totals live in the same tent. If you’re weighing a team total, the schedule-adjusted version of that offense is the number that matters, not the raw average. For a broader weekly process, the NCAAF picks hub walks through the full handicapping routine.
NCAAF injury report: the variable SOS can’t see
The NCAAF injury report tells you who is actually available, which matters more than any schedule rating on game day. College football has no league-wide mandated report like the NFL, so availability news trickles out through school announcements, beat writers, and conference availability reports where a conference publishes them.
This is where SOS quietly fails. A team might rank as having faced a tough slate, but if the opposing quarterback room was decimated during those games, the defensive numbers are flattering. Same logic in reverse for an offense that faced backups.
Check three things before kickoff: the probable starter at quarterback, the status of the top two skill players, and any offensive line absences. A patchwork line changes both the run game and the sack numbers, and it moves prop lines more than a schedule rank ever will. Usage and role shifts from those absences are worth tracking in the same way you’d read college football rushing props, because a new lead back inherits the carries and the line.
NCAAF overtime rules and the totals you can’t model
NCAAF overtime rules hand each team a possession at the opponent’s 25-yard line, and the format tightens as it goes. Starting with the second extra period, teams must attempt a two-point conversion after a touchdown. From the third overtime on, they trade alternating two-point conversion plays instead of running full possessions. The official NCAA football page has the current rulebook language.
Why care? Because overtime wrecked a lot of totals and spreads last season, and no strength of schedule number predicted it. Two-point conversion shootouts produce scoring swings that make a 44-point total land on 55. If you bet totals, price in the possibility of extra possessions rather than assuming regulation scoring.
Bowl game picks: when schedule comparisons break
Bowl game picks need a different lens, because rosters change more than schedules do in December. Opt-outs, portal departures, interim coaches, and NFL draft decisions can gut a depth chart that carried a team all season.
A team that beat a tough schedule in October may show up in December without its starting quarterback and two best receivers. Meanwhile, the opponent from a weaker conference arrives intact and motivated. Schedule strength in the abstract says one thing. The actual 22 on the field says another.
Treat bowl season as a fresh evaluation. Rebuild the matchup from who’s practicing, not from a September SOS rank. If you’re researching matchup props for a bowl game, those situation changes are exactly what the NCAAF props preview is built to show, with prices side by side instead of in ten different tabs.
A five-minute weekly routine
Schedule evaluation doesn’t need to be a project. This is the loop I run every week of the season:
- Pull one opponent-adjusted rating per team. One source, used consistently, beats five sources compared loosely.
- Delete non-FBS games from the sample.
- Flag any team whose last three opponents were significantly better or worse than its first three.
- Cross-check availability news before locking anything in.
- Write down the number you bet and why. Variance is real, and the record is how you learn whether your schedule read actually works.
That’s the honest version of this stat. Schedule strength is a lens for reading a team’s numbers, not a crystal ball. Bet within your means, expect losing streaks even from good process, and remember it’s 21+ only where legal. If it stops being fun, 1-800-GAMBLER is there.
For the wider betting picture, the college football player props guide and the anytime touchdown props guide cover how to turn team-level reads into individual markets.
Free preview
See today’s college football player props on StatsBench
Live lines, last-10 hit rates and the best price across 30+ books and pick’em apps. No account needed to look.
Prefer email? Get the daily picks newsletter.
Frequently Asked Questions
Does strength of schedule actually matter for college football betting?
Yes, but as a filter rather than a prediction. It tells you whether a team’s raw stats were built against real competition or against soft opponents, which changes how much weight those numbers deserve.
What counts as a good strength of schedule in NCAAF?
There’s no universal cutoff because every model scales differently. What matters is relative position within the same rating system, and whether non-FBS games were included in the calculation.
How do I calculate strength of schedule myself?
Start with opponents’ win percentages, then improve it by removing games against FCS teams and weighting by each opponent’s per-play efficiency. Track it weekly rather than setting it once in August.
Do bowl games count toward strength of schedule?
Bowl results are usually excluded from regular-season SOS calculations, and bowl rosters change so much through opt-outs and transfers that they’re a poor guide to team quality anyway.
Where can I compare NCAAF player prop prices?
StatsBench lists NCAAF player props with prices from multiple sportsbooks, DFS apps, and exchanges in one view, so you can see the best available number instead of checking each book separately.
 Today's NBA picks



 Today's NFL picks



 Today's NHL picks



 Today's College Football picks

 Today's EPL picks



 Today's La Liga picks



 Today's Serie A picks



 Today's Bundesliga picks



 Today's Ligue 1 picks



 Today's EFL Championship picks



 Today's CS2 picks


 Today's LoL picks


 Today's Dota 2 picks


 PHI
 DET
 BOS
 ATL
 TOR
 CLE
 NY
 WSH
 MIA
 CHA
 IND
 ORL
 BKN
 CHI
 MIL
 POR
 LAL
 HOU
 OKC
 SA
 MEM
 MIN
 GS
 DEN
 NO
 DAL
 PHX
 LAC
 UTAH
 SAC
 BUF
 DEN
 PIT
 JAX
 KC
 CIN
 NE
 CLE
 LV
 BAL
 HOU
 NYJ
 IND
 MIA
 TEN
 LAC
 SF
 MIN
 NYG
 CAR
 CHI
 DET
 GB
 SEA
 LAR
 TB
 ATL
 ARI
 DAL
 WSH
 NO
 PHI
 CAR
 BOS
 MTL
 OTT
 TB
 NJ
 FLA
 TOR
 BUF
 NYR
 DET
 WSH
 NYI
 CBJ
 PIT
 PHI
 EDM
 MIN
 VGK
 UTA
 DAL
 SEA
 COL
 NSH
 STL
 ANA
 CGY
 SJ
 WPG
 LA
 CHI
 VAN
 MIA
 UGA
 UTAH
 ND
 UCLA
 IU
 BYU
 UK
 ALA
 TEX
 OSU
 MISS
 TTU
 WAKE
 LSU
 TENN
 HOU
 USC
 MIZ
 BOIS
 IOWA
 UNM
 SC
 ARIZ
 FLA
 ARS
 MCI
 BHA
 CHE
 LIV
 BRE
 EVE
 BOU
 TOT
 AVL
 Hull City
 LEE
 NEW
 IPS
 FUL
 Coventry
 MUN
 CRY
 NFO
 SUN
 BAR
 ATM
 RMA
 BET
 RSO
 SEV
 ATH
 DEP
 VIL
 CEL
 ALA
 RAY
 GET
 ESY
 OSA
 RAC
 ELC
 LVT
 VAL
 MAL
 LAZ
 INT
 ROM
 COM
 MIL
 Frosinone
 JUV
 NAP
 BOL
 TOR
 GEN
 CAG
 ATA
 LEC
 PRM
 FIO
 SAS
 MON
 UDI
 VEN
 FCB
 BVB
 SCF
 RBL
 SVW
 B04
 SV Elversberg
 SGE
 M05
 FCA
 VFB
 TSG
 KOE
 SC Paderborn 07
 HSV
 FCU
 FC Schalke 04
 BMG
 PSG
 LOSC
 LYO
 PFC
 REN
 OM
 ASM
 NCE
 LEN
 B29
 LOR
 TOU
 STR
 AUX
 ANG
 Troyes
 Le Mans
 LEH