
The difference between a prediction interval and a confidence interval is simple. One describes a range for a long-run rate. The other describes a range for a single future result. That distinction sounds academic until you’re staring at a 6-of-10 hit rate and a -177 price, which is exactly where a lot of prop bettors talk themselves into bad tickets.
Most published prop hit rates are estimates from small samples. The outcomes you actually bet on are noisy by design. Keeping the two ideas separate is what stops your research from quietly turning into a hunch.
Prediction interval vs confidence interval: the short version
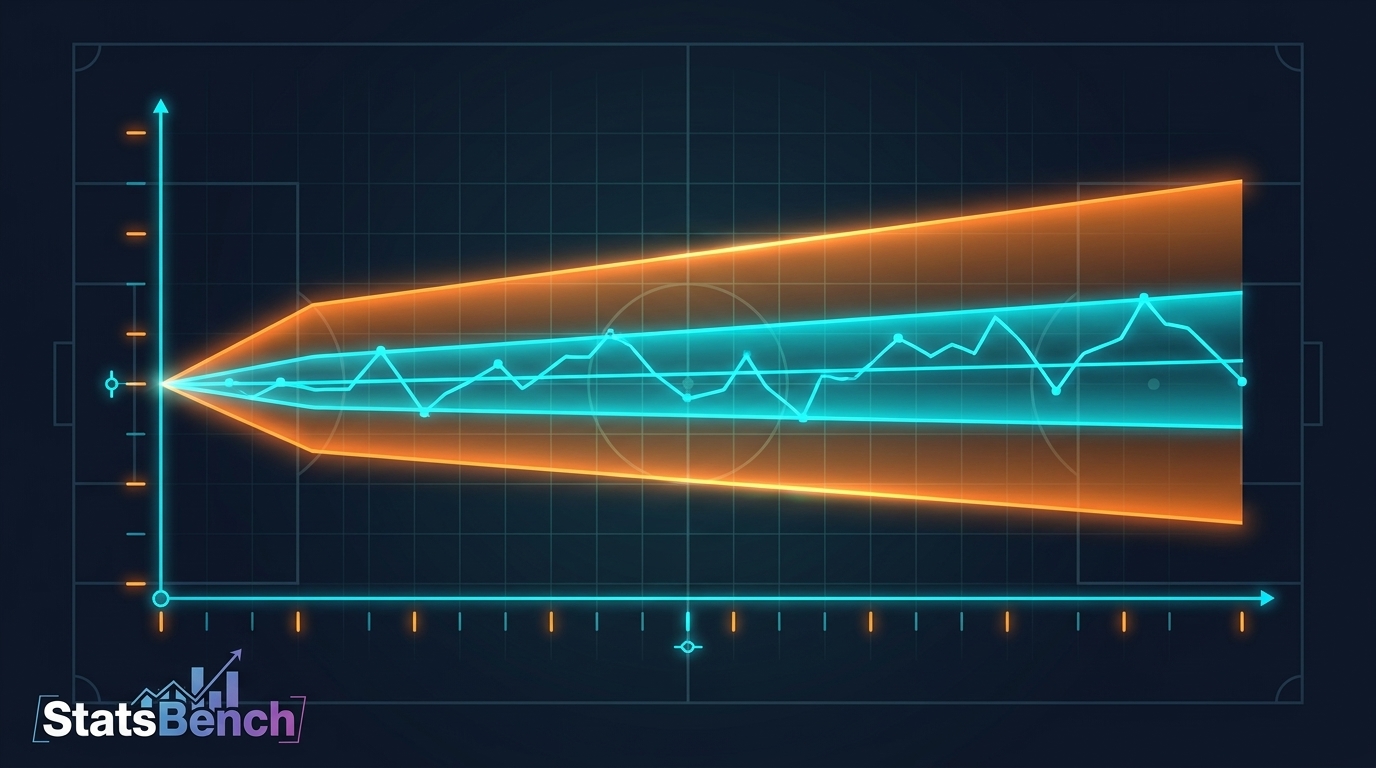
A confidence interval tells you how well you know a player’s true rate. A prediction interval tells you how wide the next result can be. The first narrows as you collect more games. The second stays wide no matter how much data you pile up.
| The question | The interval that answers it |
|---|---|
| How reliable is this player’s 60% hit rate? | Confidence interval |
| Where will that rate land by season’s end? | Confidence interval |
| How many hits will he get over the next 10 games? | Prediction interval |
| Will he record a hit tonight? | Prediction interval |
Key takeaway: a prediction interval is always wider than a confidence interval, and it never shrinks with more data. Confusing the two is the most common stats error in prop betting.
What a confidence interval actually tells you
Pull a real row. In a StatsBench cheatsheet snapshot from September 17, 2026, Garrett Mitchell’s 0.5 hits line showed a 60% hit rate over a 6-of-10 sample, with a best price of -177. That sample is the entire evidence base.
Run a standard binomial interval on 6 of 10 and the plausible range for his true hit rate lands somewhere around 30% to 85%. Ten games cannot separate a 40% hitter from a 75% one. The estimate is real, but it carries a wide error bar that most prop graphics quietly leave out (the Wikipedia entry on confidence intervals walks through the mechanics).
So “60% hit rate” is not a property of the player. It’s an estimate from a small sample. As games pile up, that bar tightens. We wrote a full piece on sample size in betting, and a companion on what 60% really means.
What a prediction interval tells you instead
Now forget the true rate for a second and ask how the next 10 games might actually look. Even if Mitchell’s real rate were exactly 60%, about one in six 10-game windows would give you four hits or fewer. That’s binomial math, not a slump.
A single game is blunter still. The line is 0.5 hits, so the result is binary: no hits, or at least one. The prediction interval for one night spans both outcomes, and it does that no matter how confident you are in the underlying rate.
That asymmetry explains a lot of frustration. Confidence tightens as you learn. Uncertainty about the next result does not care how much you’ve learned. If you’ve had a week where the process felt right and the results didn’t, you were living in the second interval. Our post on variance in betting covers the same ground from the bankroll side, and Wikipedia defines prediction intervals if you want the formal version.
Why a 60% hit rate can be priced at -170
This is where both intervals meet the odds board. Below is a slice of that same September 17, 2026 snapshot, taken from the Milwaukee at Pittsburgh game. Every row shows a 60% hit rate from a 6-of-10 sample. The prices are nothing alike.
| Player | Market | Line | Hit rate (sample) | Best price | Breakeven win rate |
|---|---|---|---|---|---|
| Garrett Mitchell | Hits | 0.5 | 60% (6/10) | -177 | about 64% |
| Garrett Mitchell | Total bases | 0.5 | 60% (6/10) | -170 | about 63% |
| Jake Bauers | Walks | 0.5 | 60% (6/10) | -140 | about 58% |
| Brice Turang | Runs | 0.5 | 60% (6/10) | -115 | about 53% |
| Joey Ortiz | Hits + runs + RBIs | 1.5 | 60% (6/10) | -110 | about 52% |
Same rate, five very different asks. At -177 you need to win roughly 64% of the time to break even, which is more than the sample has shown. At -110 you need about 52%, which is less. The research question isn’t “is he 60%?” It’s “is 60% from 10 games enough to justify this price?”
StatsBench flagged the Mitchell total bases row with a 1.8% edge, the kind of small gap that shows up when a price drifts away from a rate. The free implied probability calculator handles that price-to-breakeven conversion for any number you plug in.
How do you use intervals without doing the math?
You don’t need to compute a confidence interval at the kitchen table. You need three habits: check the sample, convert the price, and accept that short runs will look wrong sometimes.
- Ask for the sample. 60% over 10 games is a hint. 60% over 100 games is a rate you can work with.
- Convert every price. -177 and -110 demand completely different win rates. Make the comparison every time.
- Compare rate to breakeven. If the hit rate sits under the price’s implied probability, the market wants more than the data supports.
- Expect noise. A true 60% rate still produces 4-of-10 stretches regularly. That’s the prediction interval doing its job.
StatsBench is built to make the first two steps cheap. The free MLB props preview shows the board, and the Pro Cheatsheet puts hit rate, matchup, consistency grade, and best odds in one sortable table. If you want to see how the filters work, our Prop Finder guide explains it.
What does a wide interval mean for your bankroll?
Wider intervals deserve smaller stakes. That’s not a slogan, it’s arithmetic. When your estimate of a true rate is fuzzy, your estimate of the edge is fuzzy too, and full-size bets on fuzzy edges are how bankrolls bleed.
Fractional Kelly staking is one way to size around that uncertainty. The Kelly criterion calculator shows what a fraction of your bankroll looks like at a given price and win rate, so you can see how fast stake size drops once the inputs get shaky. Season-long numbers from a source like MLB.com are also worth pulling next to a 10-game window, since a season rate rests on a much bigger sample.
Three mistakes bettors make with these ranges
Most of the damage comes from three habits.
- Treating 10 games as a true rate. That’s the confidence interval getting ignored. The error bar on a 6-of-10 sample is enormous.
- Assuming a high rate makes one bet safe. That’s the prediction interval getting ignored. One game is one draw from a noisy process.
- Shopping the rate but not the price. A 60% rate at -177 and a 60% rate at -110 are different propositions, and only one of them may be worth your money.
None of this guarantees an outcome. It’s a way to keep your read honest and your sizing sane. Bet within your means, 21+ where legal, and if it stops being fun, call 1-800-GAMBLER.
Free preview
See today’s MLB player props on StatsBench
Live lines, last-10 hit rates and the best price across about 60 books. No account needed to look.
Open the MLB player props board →
Prefer email? Get the daily picks newsletter.
Frequently Asked Questions
What is the difference between a prediction interval and a confidence interval?
A confidence interval is a range for a long-run rate, so it tightens as you add games. A prediction interval is a range for a single future result or a short run of them, and it stays wide no matter how much data you collect.
Which interval matters more for a single prop bet?
The prediction interval, because you’re betting on one game rather than on a long-run rate. Your confidence interval tells you how much to trust the rate behind the bet, and the prediction interval tells you how noisy the result will be.
Does a 60% hit rate mean I should take the over?
Not on its own. A 60% rate from a 10-game sample carries a wide confidence interval, and the price still has to offer value. At -177 you need roughly 64% to break even, which is more than that sample shows.
How many games make a hit rate reliable?
There’s no magic number, but the error bar shrinks quickly as the sample grows. Ten games is a hint, a full season starts to look like a rate, and role, usage, and matchup context still shape how much weight the raw rate deserves.
Where can I see hit rates, samples, and best prices together?
The StatsBench cheatsheet lines up hit rate, sample, consistency grade, matchup, and best odds in one sortable table. The free MLB props preview shows the board without an account.