
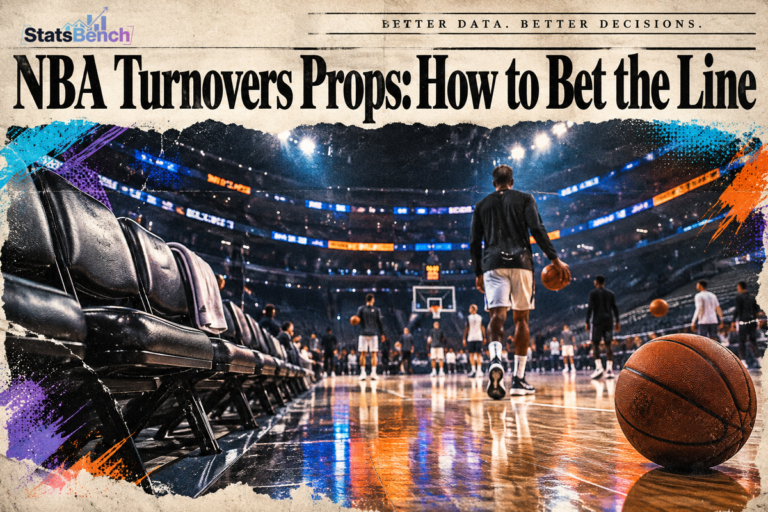
NBA turnovers props are bets on how many giveaways a player records against a line set by the book, usually 1.5, 2.5 or 3.5. You take the over or the under. One lazy cross-court pass in the fourth quarter can settle it.
That single-play swing is why this market deserves a closer look. Points props get all the traffic. Turnover lines sit in a quieter corner of the board, and quiet corners tend to get less scrutiny from the market.
Here’s how the market works, what actually moves the number, and how to price a line before you put money on it.
What Is an NBA Turnovers Prop?
A turnover prop asks one question: will this player finish with more or fewer giveaways than the posted number? The bet settles on his individual box score, not the team total.
Most books post half-point lines (1.5, 2.5, 3.5) so there’s no push. A whole number like 3 can push and refund your stake, which changes the math slightly.
The tricky part is frequency. Turnovers are rare events compared with points or minutes. A guard who averages 2.6 a game might post zero on a clean night, then five against a team that presses full court. The line sits near the median, so the tails decide most tickets.
Why Turnover Lines Don’t Behave Like Points Lines
Small counts create wide swings. That’s the whole story.
- Low counts mean high variance. Scoring 20 points has a thousand paths. Recording 3 turnovers has maybe six. A single strip in transition flips the result.
- The distribution is lopsided. Turnover counts bunch up near zero and thin out fast. They don’t look like the neat bell curve people picture when they hear “average.”
- Last-10 hit rates are noisy. A 6-of-10 sample tells you something. It just tells you less than the same sample would on a rebounds line.
- Matchup outweighs season average. A defense that forces live-ball steals can add a turnover or two to a ball handler’s night. Soft coverage can take them away.
So treat the hit rate as a starting point, not a conclusion. Pair it with the price. Our breakdown of hit rate vs edge walks through the difference, and variance in betting explains why a correct read can still lose four nights running.
What Actually Drives Turnovers?
Five things, in rough order of importance.
- Usage and time on ball. The more possessions a player initiates, the more chances he has to give it away. A high-usage creator always carries a higher line than a rim runner. For the full explanation of usage, read NBA usage rate explained.
- Role and handle. Backup guards pressed into starter minutes are a classic over candidate. So are bigs asked to run dribble handoffs against switching defenses.
- Opponent pressure. Does the defense pick up full court? Does it blitz ball screens? Does it have a wing who gambles for steals? Those schemes generate giveaways, and plenty of staffs live with the tradeoff.
- Pace. More possessions, more chances to lose the ball. A shootout inflates both teams’ turnover counts.
- Minutes and game script. Blowouts cut starters’ minutes, and that cuts both over and under tickets. Check the spread before you check the line.

Notice what’s missing from that list: last week’s box score. Form matters less here than role and matchup.
How Do You Read a Turnovers Line?
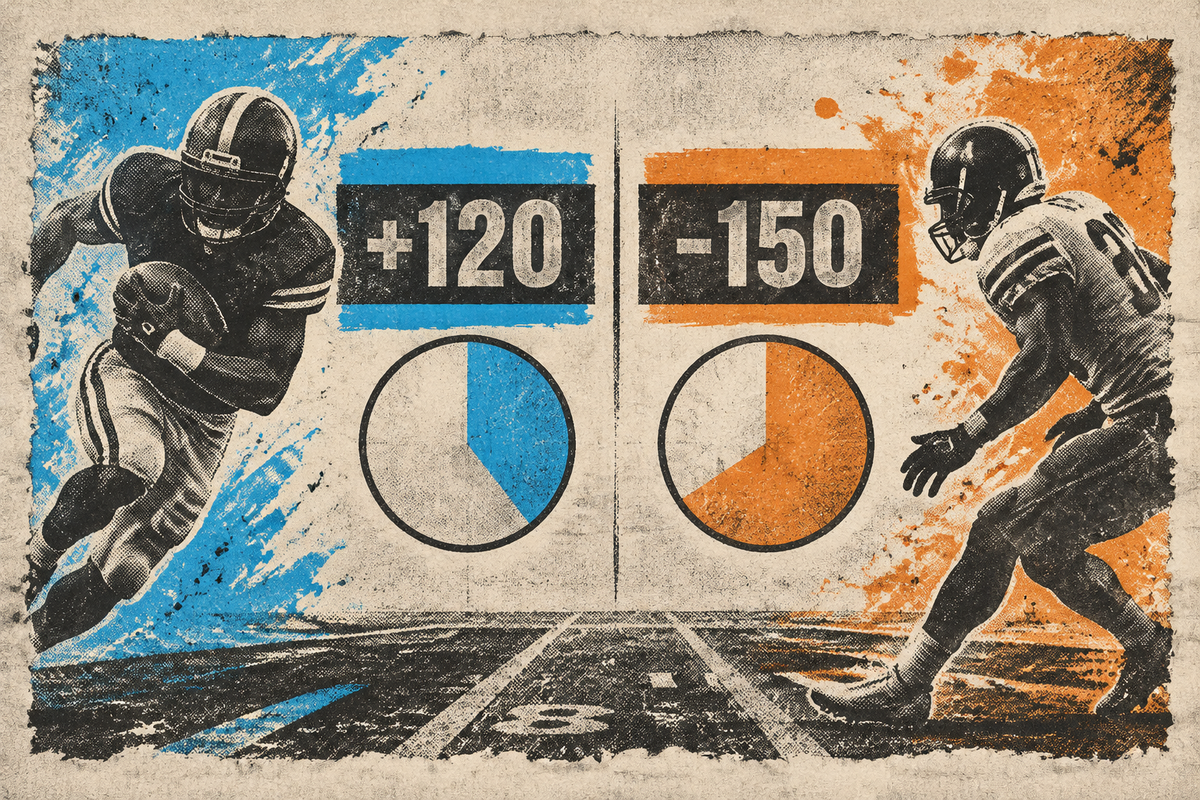
Convert the price to a break-even rate, then compare it to what you think the true rate is. The rest is judgment.
| Price | Implied win rate you need |
|---|---|
| -150 | 60.0% |
| -130 | 56.5% |
| -110 | 52.4% |
| +100 | 50.0% |
| +120 | 45.5% |
That table is the entire argument for line shopping. The same 60% hit rate is a break-even bet at -150 and a comfortable one at +100.
The implied probability calculator runs the conversion for you. Two more habits worth building: look at both sides of the market before you pick, and check whether the two prices add up to more than 100%. That extra is the vig, and the de-vig calculator strips it out to show the market’s true read on the number.
Over or Under: Which Side Is Usually Priced Better?
Neither, permanently. Books shade lines toward the side they expect the public to take, and public leanings shift by player and by market.
Stars draw under money, because casual bettors assume stars don’t give it away. Bench guards draw over money. When you see a lopsided market like -140 over and +105 under on the same line, the book is telling you where the money went, not where the value is.
That imbalance is your cue to look harder at the cheap side. Price both, then decide.
How Turnover Props Compare to Steals and Assists Props
Turnovers are an offensive stat. Steals are a defensive one, and they belong to the player forcing the action rather than the one losing it. That matters when you’re reading a matchup: a defense that racks up steals is also inflating turnovers on the other side of the ball.
Assists are the closest relative. High-usage playmakers pile up both, and the two markets often move together when a starter sits. If you’re building a same-game parlay, be careful about pairing an assists over with a turnovers under for the same player. More time on ball usually pushes both numbers up.
Worth reading alongside this one: NBA steals props and NBA assists props. Same player, different mechanics, and the line logic is not interchangeable.
A Real Board Example: Franz Wagner at 2.5
Here’s a snapshot from the StatsBench board on November 1, 2026, for a Magic vs. Celtics game.
Franz Wagner’s turnovers line was posted at 2.5, with a 60% hit rate (6 of his last 10), a 0.6% edge against the market price, and a best available price of -150.
Run the math. At -150 you need to win 60% of the time just to break even. The hit rate and the break-even rate land in the same place. Whatever edge exists is thin, and a 10-game sample can’t carry that weight alone.
That’s not a knock on the number. It’s the reminder that a good hit rate and a good bet aren’t the same thing. The prop shows a small positive edge, and it’s still one deflection away from a 5-turnover night.
What would change the read?
- Does Boston pressure ball handlers, or sit back and protect the paint?
- Is Wagner initiating more with the second unit, or playing off the ball?
- Has the line already moved from 2.5 to 3?
Those questions move a turnover line far more than a month-long average does. Official box scores on NBA.com and season logs on Basketball-Reference are the fastest way to check the role and the matchup yourself.
Three Mistakes That Cost Money on Turnover Props
Most losing tickets in this market come from the same three habits.
- Betting the hit rate and ignoring the price. 70% sounds great until you see the line priced at -260.
- Ignoring minutes risk. A 14-point spread means your starter might play 26 minutes instead of 36. That’s a third of his chances gone.
- Trusting an eight-game sample. Small counts need bigger samples, not smaller ones. Stretch the window to 20 or 30 games when you can.
None of that is exotic. It’s just work most bettors skip on a market they consider boring.
Line Shopping Is the Cheapest Fix
Turnover props are thin markets. Prices scatter.
On a two-way market, the gap between -150 and -120 is not cosmetic. -150 needs 60%. -120 needs 54.5%. That 5.5-point swing dwarfs most of the edges you’ll find on the prop itself.
The NBA props preview shows how the board reads: line, hit rate, edge, and the best price on each side across 30+ sportsbooks, DFS apps and exchanges. Sorted that way, the question stops being “who do I like” and starts being “where is this number priced wrong.”
Bankroll Notes Before You Bet These
Turnover props are high-variance bets dressed up as small numbers. Size them accordingly. A flat unit per bet beats chasing a 70% hit rate built on eight games.
Bet within your means, treat it as entertainment plus analysis, and remember that 21+ applies. If betting stops being fun, the National Problem Gambling Helpline is 1-800-GAMBLER.
Nothing here guarantees a result. Any edge shows up over hundreds of bets, not over a weekend.
Free preview
See today’s NBA player props on StatsBench
Live lines, last-10 hit rates and the best price across 30+ books and pick’em apps. No account needed to look.
Open the NBA player props board →
Prefer email? Get the daily picks newsletter.
Frequently Asked Questions
What is a turnover prop in the NBA?
It’s a bet on whether a specific player will finish with more or fewer turnovers than a line set by the sportsbook, usually posted at 1.5, 2.5 or 3.5. The bet settles on the player’s individual box score, not the team total.
Are NBA turnovers props a good bet?
They can be, but the market is thin and the counts are low, so variance is high. Value comes from comparing a realistic turnover rate to the break-even rate implied by the price. No side is automatically profitable.
What hit rate do I need to break even on a turnover prop?
It depends on the price. At -110 you need about 52.4%, at -130 about 56.5%, and at -150 a full 60%. Convert the odds to implied probability before you compare it to any hit rate.
Can a turnover prop push?
Half-point lines like 1.5 or 2.5 cannot push, so you always get a result. Whole-number lines such as 3 can push and refund your stake, which slightly changes the math.
How many games should I look at for a turnovers sample?
Ten games is thin for a stat this volatile. Stretch to 20 or 30 when the logs allow it, and weight role, minutes and opponent pressure heavily, since those move the number more than recent form does.
 Today's NBA picks


 Today's NFL picks

 Today's NHL picks



 Today's College Football picks


 Today's EPL picks



 Today's La Liga picks



 Today's Serie A picks



 Today's Bundesliga picks



 Today's Ligue 1 picks



 Today's EFL Championship picks



 Today's CS2 picks


 Today's LoL picks



 Today's Valorant picks
 Today's Dota 2 picks

 PHI
 DET
 BOS
 ATL
 TOR
 CLE
 NY
 WSH
 MIA
 CHA
 IND
 ORL
 BKN
 CHI
 MIL
 POR
 LAL
 HOU
 OKC
 SA
 MEM
 MIN
 GS
 DEN
 NO
 DAL
 PHX
 LAC
 UTAH
 SAC
 BUF
 DEN
 PIT
 JAX
 KC
 CIN
 NE
 CLE
 LV
 BAL
 HOU
 NYJ
 IND
 MIA
 TEN
 LAC
 SF
 MIN
 NYG
 CAR
 CHI
 DET
 GB
 SEA
 LAR
 TB
 ATL
 ARI
 DAL
 WSH
 NO
 PHI
 CAR
 BOS
 MTL
 OTT
 TB
 NJ
 FLA
 TOR
 BUF
 NYR
 DET
 WSH
 NYI
 CBJ
 PIT
 PHI
 EDM
 MIN
 VGK
 UTA
 DAL
 SEA
 COL
 NSH
 STL
 ANA
 CGY
 SJ
 WPG
 LA
 CHI
 VAN
 MIA
 UGA
 UTAH
 ND
 UCLA
 IU
 BYU
 UK
 ALA
 TEX
 OSU
 MISS
 TTU
 WAKE
 LSU
 TENN
 HOU
 USC
 MIZ
 BOIS
 IOWA
 UNM
 SC
 ARIZ
 FLA
 ARS
 MCI
 BHA
 CHE
 LIV
 BRE
 EVE
 BOU
 TOT
 AVL
 Hull City
 LEE
 NEW
 IPS
 FUL
 Coventry
 MUN
 CRY
 NFO
 SUN
 BAR
 ATM
 RMA
 BET
 RSO
 SEV
 ATH
 DEP
 VIL
 CEL
 ALA
 RAY
 GET
 ESY
 OSA
 RAC
 ELC
 LVT
 VAL
 MAL
 LAZ
 INT
 ROM
 COM
 MIL
 Frosinone
 JUV
 NAP
 BOL
 TOR
 GEN
 CAG
 ATA
 LEC
 PRM
 FIO
 SAS
 MON
 UDI
 VEN
 FCB
 BVB
 SCF
 RBL
 SVW
 B04
 SV Elversberg
 SGE
 M05
 FCA
 VFB
 TSG
 KOE
 SC Paderborn 07
 HSV
 FCU
 FC Schalke 04
 BMG
 PSG
 LOSC
 LYO
 PFC
 REN
 OM
 ASM
 NCE
 LEN
 B29
 LOR
 TOU
 STR
 AUX
 ANG
 Troyes
 Le Mans
 LEH