Donovan Mitchell props for Cleveland’s game at Philadelphia are a good test case for combo betting. In a StatsBench snapshot from October 22, 2026, three of his markets all sit at a 60% hit rate. Same player, same game, three different prices.
That is where the useful work starts. When a book posts points + rebounds, points + assists, and points + rebounds + assists for one player, those numbers describe a single stat line. You can solve for it with subtraction.
Donovan Mitchell props: the three combo lines
Here is what the snapshot shows. Hit rate is the share of the 10-game sample where the line cleared. Edge compares the best available price to StatsBench’s fair-price estimate.
| Market | Line | Hit rate | Edge | Best price |
|---|---|---|---|---|
| Points + rebounds | 30.5 | 60% (6/10) | 2.7% | -110 |
| Points + assists | 31.5 | 60% (6/10) | 0.0% | -112 |
| Points + rebounds + assists | 35.5 | 60% (6/10) | 0.9% | -110 |
Look at the hit rates first. All three say 60%. Now look at the prices and the edge column. They do not agree.
Why three markets show the same 60%
Points sit inside every one of those lines. When Mitchell scores, all three combos move together. That overlap is why the hit rates land on the same number.
It is also why the number is weaker than it looks. Six of ten is a small sample. One different bounce and it is five of ten. A 60% hit rate over ten games is a hint, not a verdict, and hit rates on small samples swing hard. The breakdown of what 60% really means is worth five minutes before you treat any of these rows as a trend.
StatsBench’s free cheatsheet lists props in the 50 to 60% band, so plenty of rows look alike at first glance. The differences hide in the price and the matchup.
Back out the implied stat line with simple subtraction
Combo props are additive. That makes them solvable.
- Points + rebounds: 30.5
- Points + assists: 31.5
- Points + rebounds + assists: 35.5
Add the first two and subtract the third. 30.5 plus 31.5 equals 62.0. Minus 35.5 leaves 26.5. That is the book’s implied points midpoint for Mitchell in this game.
Now isolate the rest. 30.5 minus 26.5 leaves about 4.0 rebounds. 31.5 minus 26.5 leaves about 5.0 assists. Add it back up and you get 26.5 plus 4.0 plus 5.0, which lands exactly on 35.5. The math closes.
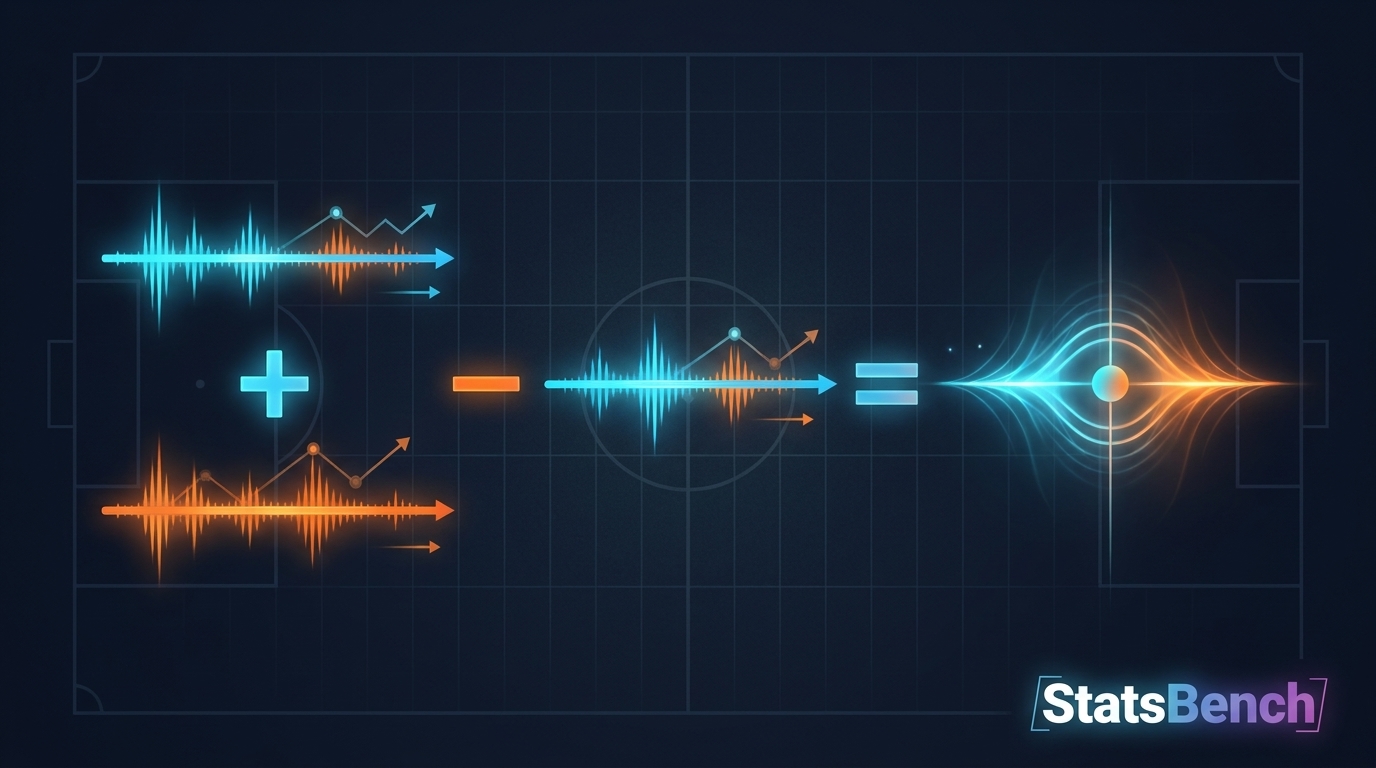
Why this helps: you now know roughly what stat line the market is pricing, without opening a projections page. If your own read on his night is far from 26.5 points, 4 rebounds, and 5 assists, you have a reason to look harder at one specific line.
Two caveats. The half-point lines and the juice mean these are midpoints, not exact means, and each market gets shaded on its own. Treat 26.5 as a rough anchor, not a number the book is admitting to.
The 60% hit rate and the 2.7% edge cannot both be the whole story
Run the naive math. If 60% were truly his probability on points + rebounds, then -110 would be a monster bet. A 60% winner at -110 returns about 14.5% on every dollar staked over the long run.
StatsBench’s edge column says 2.7%. That gap is the lesson.
The hit rate is a description of ten games. The edge is a comparison between the best price on the board and a fair price built from sharp-book consensus. The market has seen more than ten games, and it prices accordingly. When a hit rate and an edge disagree that loudly, the edge is the number with more information behind it.
So use the hit rate to understand the shape of a player’s season. Use the price to decide whether there is a bet.
Which of the three is the better bet?
Start with breakeven, not hit rate. At -110 you need to win 52.4% of the time to break even. The implied probability calculator turns any price into that number in a couple of seconds.
Then compare. In this snapshot, points + rebounds at -110 carries a 2.7% edge. Points + assists at -112 shows 0.0%. Points + rebounds + assists at -110 shows 0.9%.
Edge here means the distance between the best available price and StatsBench’s fair-price estimate, which is derived from sharp books. It is a price measurement, not a forecast. A 2.7% edge says the number is slightly better than fair. It says nothing about whether he clears 30.5 on this particular night.
That is the honest read. One line looks mildly underpriced. Two look about right. Most props look about right, which is the entire reason a filter exists.
Check the matchup before you trust the line
Combo props are sensitive to game script. A blowout trims minutes. A slow pace trims possessions. A defender who can switch onto Mitchell changes how many of those possessions end in his hands.
The NBA props preview board gives you filters for this: defensive rankings vs position, home and away splits, back-to-backs, and consistency grades. You can sort instead of guessing.
One rule. Do not assume a defense is soft because of last season’s reputation. Check the current rank against his position, then decide whether 30.5 still looks right. Roster and schedule context is on NBA.com if you want the official version.
Price shopping is the boring edge
The same combo can sit at -105 at one book and -115 at another. That spread is the cheapest edge available, and it requires no opinion about the game at all.
StatsBench compares prices across 30+ sportsbooks, including FanDuel, DraftKings, BetMGM, Caesars, and bet365. On a $100 bet, moving from -112 to -110 is worth about $1.60. Small on its own. Repeat it across a season of props and it stops being small. The odds converter helps when books post the same number in different formats.
Size the bet like the edge is small
A 2.7% edge does not justify a big bet. It justifies a small one, repeated, across a lot of bets.
Fractional Kelly is the standard tool for that. It converts edge and price into a stake as a share of bankroll. The Kelly criterion calculator runs the math, and StatsBench’s staking presets apply a 5% bankroll cap on top of it. That cap exists for a reason: edges are estimates, and estimates are sometimes wrong.
If you have never sized a bet this way, the Kelly criterion guide walks through the trade-off between growth and drawdown.
What would change this read?
Three things, mostly.
- Sample. Ten games is a skim. A longer window smooths the noise and shows whether the 60% holds up.
- Line movement. If points + rebounds drifts from 30.5 to 32, the price edge you saw is gone and the bet is a different bet.
- Role. Usage shifts with injuries, rotation changes, and blowout risk. A combo line built around 26.5 implied points assumes a normal night of touches.
On sample size specifically, the guide to how much data is enough beats scrolling another box score.
The bottom line on combo lines
Combos reward a little arithmetic. Three lines for one player describe one stat line, and subtraction gets you close to it. From there, the price decides whether anything is worth betting.
Do this for a few players on a slate and you will start to see the difference between a line that looks good and a line that pays. Prices move, so check the board again before you bet. And keep the date in mind: these were the numbers on October 22, 2026, not a standing recommendation.
Bet within your means. Nothing here is a guarantee, and a positive edge on a small sample can still lose for a while. If betting stops being fun, help is available at 1-800-GAMBLER. 21 and over.
Free preview
See today’s NBA player props on StatsBench
Live lines, last-10 hit rates and the best price across 30+ books and pick’em apps. No account needed to look.
Open the NBA player props board →
Prefer email? Get the daily picks newsletter.
Frequently Asked Questions
What are Donovan Mitchell’s combo prop lines right now?
In a StatsBench snapshot from October 22, 2026, Mitchell’s points + rebounds line sat at 30.5, points + assists at 31.5, and points + rebounds + assists at 35.5. All three showed a 60% hit rate over the tracked 10-game sample. Lines move constantly, so check the board before you bet.
Does a 60% hit rate mean a prop is a good bet?
No. A 60% hit rate over ten games is a small sample, and it says nothing about the price. A prop is only worth betting when the available odds sit above the fair price, which is what the edge column measures.
How do you work out a player’s implied stat line from combo props?
Add the points + rebounds line to the points + assists line, then subtract the points + rebounds + assists line. The result is the market’s implied points midpoint. Subtract that from each two-stat combo to get implied rebounds and assists.
What is the breakeven rate at -110 odds?
You need to win 52.4% of the time at -110 to break even, because the implied probability of -110 is 52.4%. Any price shorter than that raises the bar.