



Final score by period
| Team | 1 | 2 | 3 | T |
|---|---|---|---|---|
| Capitals |
1 | 2 | 1 | 4 |
| Predators |
1 | 1 | 1 | 3 |
How the bets settled
Closing line, DraftKings.
Game review
Washington Capitals beat Nashville Predators 4-3, with the game swinging in the second period. After a 1-1 first, the Capitals scored twice and gave up one in the middle frame to take a 3-2 lead, then matched Nashville’s one third-period goal.
Filip Forsberg scored twice for Nashville, and Roman Josi had three assists and three points. Cole Hutson scored twice for Washington, while Aliaksei Protas added two assists. Nashville won 60.7% of faceoffs and converted one of three power plays, but Washington held a 23-17 edge in hits and a 10-9 edge in blocked shots, helping it protect the one-goal margin.
For bettors, the Predators covered the closing 1.5 spread by 0.5, and the closing total of 6.5 went over by 0.5.
Against the spread, start to finish
Top performers
Capitals
 GoalsCole Hutson2
 AssistsAliaksei Protas2
- PointsCole Hutson2
Predators
 GoalsFilip Forsberg2
 AssistsRoman Josi3
- PointsRoman Josi3
Team stats
CapitalsPredatorsBox score
Washington Capitals
Forwards
| Player | G | A | SOG | S | +/- | TOI | SHFT | HT | BS | TK | GV | PIM | FO% |
|---|---|---|---|---|---|---|---|---|---|---|---|---|---|
 Anthony Beauvillier LW |
0 | 0 | 0 | 1 | 0 | 9:40 | 12 | 2 | 0 | 0 | 0 | 0 | 0.0 |
 Pierre-Luc Dubois LW |
0 | 1 | 0 | 2 | 2 | 17:07 | 20 | 1 | 1 | 0 | 0 | 0 | 30.8 |
 Boone Jenner C |
1 | 0 | 0 | 1 | 1 | 16:09 | 22 | 2 | 0 | 0 | 2 | 0 | 21.4 |
 Jordan Kyrou RW |
0 | 1 | 0 | 4 | 1 | 14:31 | 18 | 1 | 1 | 0 | 6 | 0 | 0.0 |
 Ryan Leonard RW |
0 | 0 | 0 | 3 | -1 | 13:53 | 16 | 2 | 0 | 0 | 0 | 0 | 0.0 |
 Alex Ovechkin LW |
0 | 0 | 0 | 3 | -1 | 10:56 | 14 | 1 | 0 | 0 | 1 | 0 | 0.0 |
 Aliaksei Protas C |
0 | 2 | 0 | 0 | 2 | 19:33 | 23 | 0 | 0 | 0 | 1 | 0 | 100.0 |
 Ilya Protas LW |
0 | 0 | 0 | 1 | 0 | 11:37 | 14 | 0 | 0 | 0 | 0 | 0 | 57.1 |
 Justin Sourdif RW |
0 | 0 | 0 | 0 | 1 | 12:50 | 18 | 1 | 1 | 0 | 3 | 0 | 60.0 |
 Dylan Strome C |
0 | 0 | 0 | 0 | -1 | 15:54 | 20 | 0 | 0 | 0 | 0 | 0 | 42.9 |
 Alex Tuch RW |
1 | 0 | 0 | 1 | 0 | 17:18 | 21 | 2 | 2 | 1 | 0 | 0 | 0.0 |
 Tom Wilson RW |
0 | 0 | 0 | 3 | 2 | 19:43 | 22 | 3 | 0 | 0 | 0 | 0 | 0.0 |
Defenses
| Player | G | A | SOG | S | +/- | TOI | SHFT | HT | BS | TK | GV | PIM | FO% |
|---|---|---|---|---|---|---|---|---|---|---|---|---|---|
 Jakob Chychrun D |
0 | 1 | 0 | 5 | -1 | 22:30 | 24 | 2 | 3 | 0 | 0 | 2 | 0.0 |
 Martin Fehervary D |
0 | 1 | 0 | 1 | 1 | 19:49 | 23 | 2 | 0 | 1 | 0 | 2 | 0.0 |
 Cole Hutson D |
2 | 0 | 0 | 2 | 2 | 18:26 | 22 | 1 | 0 | 1 | 0 | 0 | 0.0 |
 Timothy Liljegren D |
0 | 0 | 0 | 0 | 0 | 15:54 | 19 | 0 | 1 | 0 | 2 | 2 | 0.0 |
 Matt Roy D |
0 | 0 | 0 | 2 | 1 | 23:07 | 25 | 1 | 1 | 0 | 1 | 0 | 0.0 |
 Jack St. Ivany D |
0 | 2 | 0 | 0 | 1 | 15:12 | 20 | 2 | 0 | 0 | 1 | 0 | 0.0 |
Goalies
| Player | GA | SA | SOS | SOSA | SV | SV% | ESSV | PPSV | SHSV | TOI | YTDG | PIM |
|---|---|---|---|---|---|---|---|---|---|---|---|---|
 Charlie Lindgren G |
3 | 28 | 0 | 0 | 25 | .893 | 20 | 5 | 0 | 60:00 | 0 | 0 |
Nashville Predators
Forwards
| Player | G | A | SOG | S | +/- | TOI | SHFT | HT | BS | TK | GV | PIM | FO% |
|---|---|---|---|---|---|---|---|---|---|---|---|---|---|
 Mavrik Bourque C |
0 | 0 | 0 | 3 | -1 | 17:08 | 21 | 2 | 0 | 0 | 0 | 0 | 60.0 |
 Ross Colton C |
1 | 0 | 0 | 4 | -1 | 15:04 | 20 | 3 | 0 | 0 | 1 | 0 | 0.0 |
 Jack Drury C |
0 | 0 | 0 | 0 | 0 | 18:15 | 21 | 0 | 0 | 0 | 0 | 0 | 40.0 |
 Adam Edstrom C |
0 | 1 | 0 | 2 | 0 | 17:15 | 22 | 3 | 0 | 2 | 2 | 0 | 0.0 |
 Filip Forsberg LW |
2 | 0 | 0 | 3 | 1 | 21:39 | 24 | 1 | 1 | 1 | 1 | 0 | 100.0 |
 Nils Hoglander LW |
0 | 0 | 0 | 0 | 0 | 10:00 | 14 | 1 | 0 | 0 | 1 | 2 | 0.0 |
 Alexander Kerfoot C |
0 | 0 | 0 | 0 | -2 | 12:29 | 19 | 2 | 0 | 0 | 0 | 0 | 50.0 |
 Jonathan Marchessault RW |
0 | 0 | 0 | 5 | -1 | 17:10 | 17 | 1 | 0 | 0 | 1 | 0 | 0.0 |
 Ryan O’Reilly C |
0 | 1 | 0 | 0 | -1 | 21:42 | 22 | 1 | 0 | 0 | 1 | 0 | 73.3 |
 Steven Stamkos C |
0 | 0 | 0 | 3 | -1 | 20:26 | 19 | 0 | 0 | 0 | 3 | 0 | 77.8 |
 Matthew Wood RW |
0 | 0 | 0 | 0 | 0 | 12:29 | 16 | 0 | 0 | 0 | 0 | 0 | 75.0 |
Defenses
| Player | G | A | SOG | S | +/- | TOI | SHFT | HT | BS | TK | GV | PIM | FO% |
|---|---|---|---|---|---|---|---|---|---|---|---|---|---|
 Nicolas Hague D |
0 | 0 | 0 | 0 | -3 | 8:39 | 12 | 0 | 0 | 0 | 1 | 2 | 0.0 |
 Daemon Hunt D |
0 | 0 | 0 | 1 | -1 | 11:51 | 18 | 0 | 2 | 0 | 0 | 0 | 0.0 |
 Roman Josi D |
0 | 3 | 0 | 6 | 1 | 22:56 | 24 | 0 | 1 | 0 | 1 | 0 | 0.0 |
 Nick Perbix D |
0 | 0 | 0 | 0 | 0 | 18:09 | 23 | 0 | 2 | 0 | 1 | 0 | 0.0 |
 Brady Skjei D |
0 | 0 | 0 | 0 | -1 | 19:47 | 26 | 1 | 1 | 0 | 1 | 0 | 0.0 |
 Jayden Struble D |
0 | 0 | 0 | 0 | -1 | 14:58 | 19 | 2 | 1 | 0 | 1 | 0 | 0.0 |
 Adam Wilsby D |
0 | 0 | 0 | 1 | 1 | 18:06 | 24 | 0 | 1 | 0 | 2 | 0 | 0.0 |
Goalies
| Player | GA | SA | SOS | SOSA | SV | SV% | ESSV | PPSV | SHSV | TOI | YTDG | PIM |
|---|---|---|---|---|---|---|---|---|---|---|---|---|
 Juuse Saros G |
4 | 29 | 0 | 0 | 25 | .862 | 21 | 4 | 0 | 57:57 | 0 | 0 |
Attendance 17,159 · Officials: Kyle Rehman, Jesse Marquis, Brandon Schrader, Joe Mahon
Recap: Cole Hutson scores twice as the Capitals beat the Predators 4-3 (ESPN)
Highlights
StatsBench picks
No StatsBench pick posted for this game. Today’s posted picks are graded live.
Betting trends
- The over has hit in 3 straight Capitals games.
From each team’s last 10 games and recent meetings, against the closing line.
 Polymarket
Affiliate link: StatsBench may earn a commission if you sign up. 18+ (21+ where required); availability depends on where you live.
Capitals vs Predators pre-game preview
Washington is a slight moneyline favorite at -110 while Nashville is -105; Nashville is +1.5 on the spread and the total is 6.5. The last meeting went to Washington 4-2 at home on February 5. Washington is 6-4 straight up and 4-6 against the spread over its last 10, with a most recent 4-3 win over Buffalo on October 24. Nashville is 3-7 straight up and 6-4 against the spread over its last 10, following a 3-4 loss to the New York Islanders on October 27.
The more useful angles are on defense and pace. Nashville allows 3.0 goals per game (12th) versus Washington’s 3.2 (17th), and Nashville allows 29.08 shots per game (25th) versus Washington’s 28.4 (21st). Washington plays at a faster pace (55.9, 9th) than Nashville (54.7, 18th), and Washington has Vincent Desharnais and Rasmus Sandin on injured reserve. Ryan O’Reilly’s over 0.5 goals at +210 has cleared in 6 of his last 10, a prop worth monitoring.
Player stats and form
Season averages and each player’s last 5 games, newest first. Splits: per-game averages (games in brackets); vs the opponent covers this season and last, newest game first.
Washington Capitals
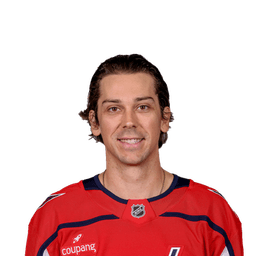
| Date | Opp | TOI | G | A | SOG | HIT |
|---|---|---|---|---|---|---|
| 10/28 | vs PHI | 15:48 | 0 | 3 | 2 | 0 |
| 10/24 | vs BUF | 20:59 | 2 | 1 | 5 | 0 |
| 10/20 | vs LAK | 18:59 | 0 | 0 | 4 | 0 |
| 10/17 | vs NJD | 18:02 | 1 | 0 | 3 | 0 |
| 10/14 | vs MTL | 18:56 | 0 | 0 | 1 | 0 |
| Splits | Season | Road | 2025-26 | vs NSH |
|---|---|---|---|---|
| PTS | 1.1 (11) | 1.0 (3) | 0.7 (80) | 1.5 (2) 2 · 1 |
| SOG | 2.4 (11) | 1.3 (3) | 1.8 (80) | 1.0 (2) 1 · 1 |
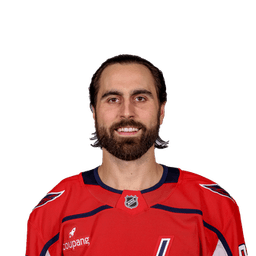
| Date | Opp | TOI | G | A | SOG | HIT |
|---|---|---|---|---|---|---|
| 10/28 | vs PHI | 18:41 | 2 | 0 | 5 | 1 |
| 10/24 | vs BUF | 22:32 | 2 | 0 | 3 | 2 |
| 10/20 | vs LAK | 18:59 | 0 | 0 | 2 | 2 |
| 10/17 | vs NJD | 18:08 | 0 | 1 | 3 | 2 |
| 10/14 | vs MTL | 18:49 | 2 | 1 | 3 | 1 |
| Splits | Season | Road | 2025-26 | vs NSH |
|---|---|---|---|---|
| PTS | 1.0 (11) | 0.7 (3) | 0.8 (92) | 1.0 (2) 1 · 1 |
| SOG | 2.9 (11) | 2.0 (3) | 2.6 (92) | 0.5 (2) 0 · 1 |
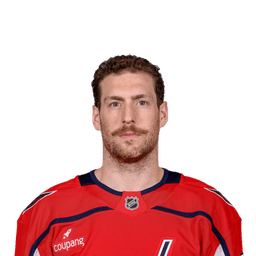
| Date | Opp | TOI | G | A | SOG | HIT |
|---|---|---|---|---|---|---|
| 10/28 | vs PHI | 13:00 | 0 | 2 | 1 | 1 |
| 10/24 | vs BUF | 18:08 | 0 | 0 | 2 | 1 |
| 10/9 | vs NYR | 20:02 | 0 | 0 | 1 | 2 |
| 10/7 | vs PIT | 17:41 | 1 | 1 | 3 | 0 |
| 10/3 | @ TBL | 18:34 | 0 | 0 | 1 | 2 |
| Splits | Season | Road | 2025-26 | vs NSH |
|---|---|---|---|---|
| PTS | 1.0 (6) | 1.0 (2) | 0.7 (29) | 2.0 (1) 2 |
| SOG | 1.5 (6) | 1.0 (2) | 1.4 (29) | 2.0 (1) 2 |
Nashville Predators

| Date | Opp | TOI | G | A | SOG | HIT |
|---|---|---|---|---|---|---|
| 10/27 | vs NYI | 20:42 | 0 | 1 | 1 | 1 |
| 10/25 | vs COL | 17:46 | 2 | 1 | 4 | 0 |
| 10/24 | @ PIT | 19:00 | 1 | 0 | 3 | 0 |
| 10/22 | @ BOS | 14:04 | 0 | 0 | 2 | 0 |
| 10/17 | vs STL | 17:38 | 0 | 2 | 1 | 0 |
| Splits | Season | Home | 2025-26 | vs WSH |
|---|---|---|---|---|
| PTS | 1.3 (12) | 1.3 (7) | 0.8 (82) | 1.0 (2) 0 · 2 |
| SOG | 2.0 (12) | 2.0 (7) | 2.5 (82) | 2.0 (2) 2 · 2 |
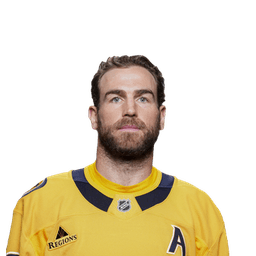
| Date | Opp | TOI | G | A | SOG | HIT |
|---|---|---|---|---|---|---|
| 10/27 | vs NYI | 24:10 | 1 | 0 | 1 | 0 |
| 10/25 | vs COL | 20:48 | 2 | 2 | 5 | 0 |
| 10/24 | @ PIT | 19:42 | 0 | 1 | 2 | 1 |
| 10/22 | @ BOS | 16:35 | 0 | 0 | 1 | 1 |
| 10/17 | vs STL | 20:34 | 1 | 0 | 4 | 0 |
| Splits | Season | Home | 2025-26 | vs WSH |
|---|---|---|---|---|
| PTS | 1.1 (12) | 1.4 (7) | 0.9 (81) | 0.5 (2) 0 · 1 |
| SOG | 2.3 (12) | 3.0 (7) | 1.9 (81) | 1.5 (2) 3 · 0 |
| Date | Opp | TOI | G | A | SOG | HIT |
|---|---|---|---|---|---|---|
| 10/27 | vs NYI | 22:47 | 1 | 1 | 4 | 3 |
| 10/25 | vs COL | 18:50 | 1 | 2 | 3 | 0 |
| 10/24 | @ PIT | 19:28 | 0 | 0 | 1 | 1 |
| 10/22 | @ BOS | 17:30 | 0 | 0 | 0 | 3 |
| 10/17 | vs STL | 19:14 | 1 | 1 | 2 | 1 |
| Splits | Season | Home | 2025-26 | vs WSH |
|---|---|---|---|---|
| PTS | 1.1 (12) | 1.4 (7) | 0.9 (82) | 0.5 (2) 0 · 1 |
| SOG | 2.7 (12) | 3.6 (7) | 3.0 (82) | 1.0 (2) 1 · 1 |
Records
| Team | Record | ATS | O/U | Home | Away |
|---|---|---|---|---|---|
| Capitals |
7-4 | 5-6 | 7-4 | 6-2 | 1-2 |
| Predators |
4-8 | 7-5 | 6-6 | 3-4 | 1-4 |
This season, regular season. ATS and O/U against each game’s closing line.
Capitals vs Predators head-to-head
Capitals are 3-3, 1-3 ATS, O/U 0-4 in the last 6 meetings. Last time: Capitals won 4-2 on February 5, 2026.
| Date | Venue | Capitals result | ATS | O/U |
|---|---|---|---|---|
| Feb 5, 26 | Capitals home | W 4-2 | W -1.5 | U 6.5 |
| Jan 11, 26 | Predators home | L 2-3 | L -1.5 | U 6.5 |
| Jan 11, 25 | Predators home | W 4-1 | – | – |
| Nov 6, 24 | Capitals home | W 3-2 | – | – |
| Dec 30, 23 | Capitals home | L 2-3 | L -1.5 | U 5.5 |
| Dec 16, 23 | Predators home | L 1-3 | L +1.5 | U 5.5 |
Recent form
Washington Capitals: last 10 (6-4, 4-6 ATS, O/U 6-4)
| Date | Opponent | Result | ATS | O/U |
|---|---|---|---|---|
| Oct 28, 26 | vs PHI | W 5-2 | W -1.5 | O 5.5 |
| Oct 24, 26 | vs BUF | W 4-3 | L -1.5 | O 6.5 |
| Oct 20, 26 | vs LA | L 2-5 | L -1.5 | O 5.5 |
| Oct 17, 26 | vs NJ | W 4-2 | W -1.5 | U 6.5 |
| Oct 14, 26 | vs MTL | W 5-4 | L -1.5 | O 6.5 |
| Oct 13, 26 | @ CAR | L 2-4 | L +1.5 | U 6.5 |
| Oct 11, 26 | vs SEA | L 3-5 | L -1.5 | O 6.5 |
| Oct 9, 26 | vs NYR | W 3-1 | W -1.5 | U 5.5 |
| Oct 7, 26 | vs PIT | W 5-3 | W -1.5 | O 6.5 |
| Oct 3, 26 | @ TB | L 1-3 | L +1.5 | U 6.5 |
Nashville Predators: last 10 (3-7, 6-4 ATS, O/U 6-4)
| Date | Opponent | Result | ATS | O/U |
|---|---|---|---|---|
| Oct 27, 26 | vs NYI | L 3-4 | L -1.5 | O 5.5 |
| Oct 25, 26 | vs COL | W 6-2 | W +1.5 | O 6.5 |
| Oct 24, 26 | @ PIT | L 2-3 | W +1.5 | U 6.5 |
| Oct 22, 26 | @ BOS | L 0-6 | L +1.5 | U 6.5 |
| Oct 17, 26 | vs STL | W 5-2 | W +1.5 | O 5.5 |
| Oct 15, 26 | vs SJ | L 2-3 | L -1.5 | U 6.5 |
| Oct 13, 26 | vs VGK | L 2-5 | L +1.5 | O 6.5 |
| Oct 10, 26 | @ OTT | L 2-3 | W +1.5 | U 5.5 |
| Oct 8, 26 | @ MTL | W 5-2 | W +1.5 | O 6.5 |
| Oct 6, 26 | @ TOR | L 4-5 | W +1.5 | O 5.5 |
Injury report
Washington Capitals
- Vincent Desharnais (D): Injured Reserve, Abdomen
- Rasmus Sandin (D): Injured Reserve, Sandin
Nashville Predators: none listed.
Matchup ranks
What each defense allows per game this season. Rank 1 allows the fewest, so a high number means a softer matchup for the other team’s overs.
| Capitals defense | Predators defense | |
|---|---|---|
| Goals allowed per game | 3.23 (18th of 32) | 3.14 (15th of 32) |
| Shots on goal allowed per game | 28.08 (22nd of 32) | 28.86 (24th of 32) |
| Points allowed per game | 8.62 (17th of 32) | 8.64 (19th of 32) |
| Power-play points allowed per game | 1.92 (15th of 32) | 1.07 (4th of 32) |
| Pace (possessions) | 55.8 (10th) | 54.7 (18th) |
Venue and weather
Capitals vs Predators odds
Line movement from the open
| Line | Open | Close | Move |
|---|---|---|---|
| Predators spread | +1.5 | +1.5 | – |
| Total | 6.5 | 6.5 | – |
| Capitals moneyline | -112 | -115 | +0.7% win chance |
| Predators moneyline | -108 | -105 | -0.7% win chance |
DraftKings opening and closing numbers via ESPN.
Line movement chart
More on these teams: Minnesota Wild vs Washington Capitals Nov 1 · Tampa Bay Lightning vs Nashville Predators Oct 31 · Philadelphia Flyers vs Washington Capitals Oct 28 · New York Islanders vs Nashville Predators Oct 27 · All NHL prop picks
21+. Research, not a guarantee: every bet can lose. Bet within your means; if gambling stops being fun, call 1-800-GAMBLER.
 Today's NBA picks

 Today's NFL picks

 Today's NHL picks


 Today's College Football picks

 Today's EPL picks



 Today's La Liga picks


 Today's Serie A picks



 Today's Bundesliga picks



 Today's Ligue 1 picks



 Today's EFL Championship picks



 Today's CS2 picks



 Today's LoL picks



 Today's Valorant picks
 Today's Dota 2 picks


 PHI
 DET
 BOS
 ATL
 TOR
 CLE
 NY
 WSH
 MIA
 CHA
 IND
 ORL
 BKN
 CHI
 MIL
 POR
 LAL
 HOU
 OKC
 SA
 MEM
 MIN
 GS
 DEN
 NO
 DAL
 PHX
 LAC
 UTAH
 SAC
 BUF
 DEN
 PIT
 JAX
 KC
 CIN
 NE
 CLE
 LV
 BAL
 HOU
 NYJ
 IND
 MIA
 TEN
 LAC
 SF
 MIN
 NYG
 CAR
 CHI
 DET
 GB
 SEA
 LAR
 TB
 ATL
 ARI
 DAL
 WSH
 NO
 PHI
 CAR
 BOS
 MTL
 OTT
 TB
 NJ
 FLA
 TOR
 BUF
 NYR
 DET
 NYI
 CBJ
 PIT
 PHI
 EDM
 MIN
 VGK
 UTA
 DAL
 SEA
 COL
 STL
 ANA
 CGY
 SJ
 WPG
 LA
 CHI
 VAN
 MIA
 UGA
 UTAH
 ND
 UCLA
 IU
 BYU
 UK
 ALA
 TEX
 OSU
 MISS
 TTU
 WAKE
 LSU
 TENN
 HOU
 USC
 MIZ
 BOIS
 IOWA
 UNM
 SC
 ARIZ
 FLA
 ARS
 MCI
 BHA
 CHE
 LIV
 BRE
 EVE
 BOU
 TOT
 AVL
 Hull City
 LEE
 NEW
 IPS
 FUL
 Coventry
 MUN
 CRY
 NFO
 SUN
 BAR
 ATM
 RMA
 BET
 RSO
 SEV
 ATH
 DEP
 VIL
 CEL
 ALA
 RAY
 GET
 ESY
 OSA
 RAC
 ELC
 LVT
 VAL
 MAL
 LAZ
 INT
 ROM
 COM
 MIL
 Frosinone
 JUV
 NAP
 BOL
 TOR
 GEN
 CAG
 ATA
 LEC
 PRM
 FIO
 SAS
 MON
 UDI
 VEN
 FCB
 BVB
 SCF
 RBL
 SVW
 B04
 SV Elversberg
 SGE
 M05
 FCA
 VFB
 TSG
 KOE
 SC Paderborn 07
 HSV
 FCU
 FC Schalke 04
 BMG
 PSG
 LOSC
 LYO
 PFC
 REN
 OM
 ASM
 NCE
 LEN
 B29
 LOR
 TOU
 STR
 AUX
 ANG
 Troyes
 Le Mans
 LEH