



| Team | Moneyline | Spread | Total |
|---|---|---|---|
| New York Islanders |
-132  |
-1.5 +188 |
O 6.5 +104 |
| San Jose Sharks |
+120  |
+1.5 -210  |
U 6.5 -117 |
Best price at bet365, BetRivers, Caesars, DraftKings, FanDuel and Fanatics, updated 3:20 PM ET.
Islanders vs Sharks preview
New York is the moneyline favorite at -129, San Jose is +112, and the total is 6.5.
The last meeting went to New York, 2-1 on the road on March 7, 2026. Over their last 10, the Islanders are 4-6 straight up and 6-4 against the spread; San Jose is 3-7 straight up and 3-7 against the spread. New York is 7-9 overall and 9-7 against the spread this season; San Jose is 7-12 and 7-12 against the spread.
San Jose’s defense ranks 29th in goals allowed at 3.58 per game and 29th in shots allowed at 30.05, and its pace rank of fifth (57.1) can keep play open. For a prop angle, Matthew Schaefer’s over 0.5 points is -215 after clearing in 8 of his last 10, with the StatsBench model projecting 0.9.
StatsBench picks
No StatsBench pick posted for this game. Today’s posted picks are graded live.
Top Islanders vs Sharks player props
| Player | Prop | Best price | Last 10 | Last 5 | Projection |
|---|---|---|---|---|---|
| Emil Heineman NYI | Over 1.5 hits | -114  Stake |
80% (8/10) | 80% | – |
| Simon Holmstrom NYI | Over 1.5 shots on goal | -130  prophetexchange |
80% (8/10) | 100% | – |
| Matthew Schaefer NYI | Over 0.5 points | -180  ESPN BET |
80% (8/10) | 80% | 0.9 |
| Michael Misa SJS | Over 0.5 points | +130  Hard Rock |
70% (7/10) | 80% | 0.6 |
| Kiefer Sherwood SJS | Over 1.5 shots on goal | -130 ESPN BET |
70% (7/10) | 40% | – |
Hit rate = how often the player cleared this line in recent games. Projection = StatsBench’s model estimate for tonight. Best price across 30+ sportsbooks, DFS apps and exchanges as of 3:20 PM ET.
Key matchups
Each player’s lines against what this defense allows to his position this season. The ranks run from the defense allowing the fewest to the one allowing the most. Bars show how often he cleared the line over his recent games, green at 70% or better.
Simon Holmstrom vs Sharks
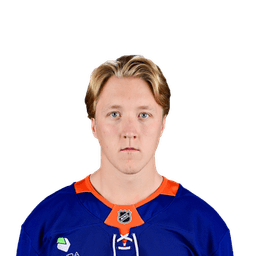 Simon HolmstromF, NYISharksDefense vs forwards

Alexander Wennberg vs Islanders
 Alexander WennbergF, SJSIslandersDefense vs forwards
Kiefer Sherwood vs Islanders
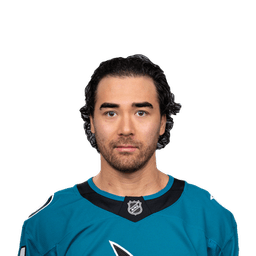 Kiefer SherwoodF, SJSIslandersDefense vs forwards

Matthew Schaefer vs Sharks
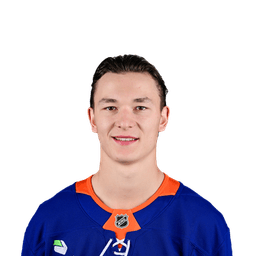 Matthew SchaeferD, NYISharksDefense vs defensemen
Emil Heineman vs Sharks
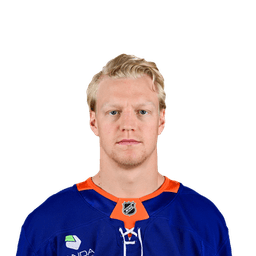 Emil HeinemanF, NYISharksDefense vs forwards
Michael Misa vs Islanders
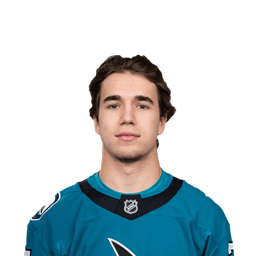 Michael MisaF, SJSIslandersDefense vs forwards
Betting trends
- Sharks are 3-7 against the spread in their last 10.
- Islanders are 5-1 in the last 6 meetings with the Sharks.
From each team’s last 10 games and recent meetings, against the closing line.
 Polymarket
Affiliate link: StatsBench may earn a commission if you sign up. 18+ (21+ where required); availability depends on where you live.
Projected lines
Projected forward lines, defense pairs and goalies, updated 3:20 PM ET; this page updates whenever they change. The goalies are listed in projected order, which doesn’t confirm the starter. Under each player: his strongest prop line and how often he cleared it over his recent games; green at 70% or better.
New York IslandersProjectedForwards
Defense
Goalies
Scratched: Scott Mayfield
Injured or in doubt: Mathew Barzal, Alexander Romanov, Ryan Pulock, Matias Maccelli, Calum Ritchie
San Jose SharksProjectedForwards
Defense
Goalies
Scratched: Nolan Allan, Adam Gaudette
Injured or in doubt: Igor Chernyshov
Islanders vs Sharks defense vs position
What each defense allows per game this season to everyone listed at a position, combined, so a row covers more than the starter. The small number is the rank across 32 teams: 1st allows the fewest. Green is the softest third of the league, red the toughest.
Islanders defense facing the Sharks
| Pos | Goals | Assists | Points | Shots | Hits | Blocks |
|---|---|---|---|---|---|---|
| F | 2.719th | 3.37th | 5.910th | 21.628th | 15.314th | 6.927th |
| D | 0.36th | 1.820th | 2.115th | 6.910th | 5.16th | 8.011th |
Softest spot: 21.6 shots a game to forwards, 5th most in the league.
Toughest spot: 0.3 goals a game to defensemen, 6th fewest in the league.
Sharks defense facing the Islanders
| Pos | Goals | Assists | Points | Shots | Hits | Blocks |
|---|---|---|---|---|---|---|
| F | 3.025th | 4.326th | 7.324th | 22.230th | 14.810th | 7.029th |
| D | 0.625th | 1.716th | 2.319th | 8.025th | 6.724th | 7.03rd |
Softest spot: 22.2 shots a game to forwards, 3rd most in the league.
Toughest spot: 7.0 blocks a game to defensemen, 3rd fewest in the league.
Player stats and form
Season averages and each player’s last 5 games, newest first. Splits: per-game averages (games in brackets); vs the opponent covers this season and last, newest game first.
New York Islanders

| Date | Opp | TOI | G | A | SOG | HIT |
|---|---|---|---|---|---|---|
| 11/7 | vs NJD | 20:32 | 0 | 2 | 2 | 1 |
| 11/5 | vs CAR | 20:56 | 0 | 0 | 3 | 2 |
| 10/31 | vs EDM | 20:29 | 0 | 0 | 3 | 1 |
| 10/29 | @ MIN | 20:57 | 1 | 0 | 3 | 2 |
| 10/27 | @ NSH | 26:04 | 1 | 0 | 2 | 2 |
| Splits | Season | Road | 2025-26 | vs SJ |
|---|---|---|---|---|
| PTS | 1.0 (16) | 1.1 (7) | 0.8 (68) | 1.0 (2) 1 · 1 |
| SOG | 3.1 (16) | 2.7 (7) | 3.3 (68) | 3.5 (2) 6 · 1 |
| Date | Opp | TOI | G | A | SOG | HIT |
|---|---|---|---|---|---|---|
| 11/7 | vs NJD | 23:37 | 1 | 0 | 3 | 2 |
| 11/5 | vs CAR | 30:01 | 0 | 1 | 2 | 0 |
| 10/31 | vs EDM | 24:33 | 0 | 0 | 2 | 3 |
| 10/29 | @ MIN | 30:01 | 2 | 1 | 6 | 1 |
| 10/27 | @ NSH | 32:16 | 0 | 1 | 2 | 1 |
| Splits | Season | Road | 2025-26 | vs SJ |
|---|---|---|---|---|
| PTS | 1.0 (16) | 0.9 (7) | 0.7 (82) | 1.5 (2) 1 · 2 |
| SOG | 3.6 (16) | 3.1 (7) | 2.7 (82) | 3.5 (2) 3 · 4 |

| Date | Opp | TOI | G | A | SOG | HIT |
|---|---|---|---|---|---|---|
| 11/7 | vs NJD | 14:32 | 0 | 1 | 3 | 4 |
| 11/5 | vs CAR | 18:17 | 1 | 1 | 1 | 3 |
| 10/31 | vs EDM | 17:48 | 0 | 0 | 0 | 3 |
| 10/29 | @ MIN | 14:18 | 0 | 0 | 1 | 2 |
| 10/27 | @ NSH | 19:15 | 1 | 0 | 1 | 3 |
| Splits | Season | Road | 2025-26 | vs SJ |
|---|---|---|---|---|
| PTS | 0.8 (16) | 0.6 (7) | 0.5 (80) | 0.0 (1) 0 |
| SOG | 1.8 (16) | 1.4 (7) | 1.5 (80) | 1.0 (1) 1 |
San Jose Sharks
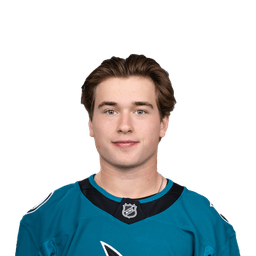
| Date | Opp | TOI | G | A | SOG | HIT |
|---|---|---|---|---|---|---|
| 11/7 | @ DAL | 28:05 | 0 | 3 | 6 | 0 |
| 11/6 | @ MIN | 24:59 | 1 | 0 | 6 | 0 |
| 11/4 | @ LAK | 22:40 | 1 | 0 | 5 | 3 |
| 11/2 | vs CGY | 22:56 | 0 | 0 | 2 | 2 |
| 10/31 | vs OTT | 19:43 | 0 | 0 | 2 | 0 |
| Splits | Season | Home | 2025-26 | vs NYI |
|---|---|---|---|---|
| PTS | 1.2 (17) | 1.1 (8) | 1.4 (82) | 1.0 (2) 1 · 1 |
| SOG | 4.2 (17) | 3.8 (8) | 3.5 (82) | 5.0 (2) 4 · 6 |

| Date | Opp | TOI | G | A | SOG | HIT |
|---|---|---|---|---|---|---|
| 11/7 | @ DAL | 23:44 | 1 | 1 | 3 | 0 |
| 11/6 | @ MIN | 21:11 | 0 | 1 | 2 | 1 |
| 11/4 | @ LAK | 21:00 | 0 | 0 | 0 | 0 |
| 11/2 | vs CGY | 18:23 | 0 | 0 | 2 | 0 |
| 10/31 | vs OTT | 17:10 | 0 | 0 | 3 | 0 |
| Splits | Season | Home | 2025-26 | vs NYI |
|---|---|---|---|---|
| PTS | 0.7 (19) | 0.8 (8) | 0.9 (69) | 0.5 (2) 1 · 0 |
| SOG | 2.5 (19) | 2.5 (8) | 2.4 (69) | 4.5 (2) 5 · 4 |

| Date | Opp | TOI | G | A | SOG | HIT |
|---|---|---|---|---|---|---|
| 11/7 | @ DAL | 19:02 | 1 | 0 | 2 | 1 |
| 11/6 | @ MIN | 12:33 | 0 | 0 | 0 | 0 |
| 11/4 | @ LAK | 13:02 | 1 | 0 | 4 | 0 |
| 11/2 | vs CGY | 16:41 | 0 | 0 | 2 | 0 |
| 10/31 | vs OTT | 15:35 | 0 | 0 | 1 | 0 |
| Splits | Season | Home | 2025-26 | vs NYI |
|---|---|---|---|---|
| PTS | 0.6 (19) | 0.4 (8) | – | – |
| SOG | 1.5 (19) | 1.0 (8) | – | – |
Records
| Team | Record | ATS | O/U | Home | Away |
|---|---|---|---|---|---|
| Islanders |
7-9 | 9-7 | 8-8 | 4-5 | 3-4 |
| Sharks |
7-12 | 7-12 | 9-10 | 3-5 | 4-7 |
This season, regular season. ATS and O/U against each game’s closing line.
Islanders vs Sharks head-to-head
Islanders are 5-1, 1-2 ATS, O/U 2-1 in the last 6 meetings. Last time: Islanders won 2-1 on March 7, 2026.
| Date | Venue | Islanders result | ATS | O/U |
|---|---|---|---|---|
| Mar 7, 26 | Sharks home | W 2-1 | L -1.5 | U 6.5 |
| Oct 21, 25 | Islanders home | W 4-3 | – | – |
| Mar 8, 25 | Sharks home | W 4-2 | – | – |
| Jan 18, 25 | Islanders home | W 4-1 | – | – |
| Mar 7, 24 | Sharks home | W 7-2 | W -1.5 | O 5.5 |
| Dec 5, 23 | Islanders home | L 4-5 | L -1.5 | O 5.5 |
Recent form
New York Islanders: last 10 (4-6, 6-4 ATS, O/U 5-5)
| Date | Opponent | Result | ATS | O/U |
|---|---|---|---|---|
| Nov 7, 26 | vs NJ | L 4-5 | W +1.5 | O 5.5 |
| Nov 5, 26 | vs CAR | L 3-5 | L +1.5 | O 6.5 |
| Oct 31, 26 | vs EDM | L 0-4 | L +1.5 | U 6.5 |
| Oct 29, 26 | @ MIN | W 4-3 | W +1.5 | O 5.5 |
| Oct 27, 26 | @ NSH | W 4-3 | W +1.5 | O 5.5 |
| Oct 25, 26 | @ DAL | L 3-6 | L +1.5 | O 5.5 |
| Oct 22, 26 | vs LA | L 2-3 | W +1.5 | U 5.5 |
| Oct 20, 26 | vs ANA | W 3-2 | L -1.5 | U 5.5 |
| Oct 17, 26 | @ TOR | W 4-1 | W +1.5 | U 6.5 |
| Oct 15, 26 | @ OTT | L 1-2 | W +1.5 | U 5.5 |
San Jose Sharks: last 10 (3-7, 3-7 ATS, O/U 5-5)
| Date | Opponent | Result | ATS | O/U |
|---|---|---|---|---|
| Nov 7, 26 | @ DAL | L 3-4 | W +1.5 | O 6.5 |
| Nov 6, 26 | @ MIN | L 1-4 | L +1.5 | U 6.5 |
| Nov 4, 26 | @ LA | L 2-7 | L +1.5 | O 6.5 |
| Nov 2, 26 | vs CGY | L 1-2 | L -1.5 | U 6.5 |
| Oct 31, 26 | vs OTT | L 1-5 | L +1.5 | U 6.5 |
| Oct 29, 26 | vs VAN | W 3-2 | L -1.5 | U 6.5 |
| Oct 27, 26 | vs BUF | L 0-2 | L +1.5 | U 6.5 |
| Oct 24, 26 | @ BOS | L 4-6 | L +1.5 | O 6.5 |
| Oct 22, 26 | @ OTT | W 6-2 | W +1.5 | O 6.5 |
| Oct 20, 26 | @ MTL | W 4-3 | W +1.5 | O 6.5 |
Injury report
New York Islanders
- Calum Ritchie (C): Injured Reserve, Lower Body
- Mathew Barzal (C): Injured Reserve, Barzal
- Alexander Romanov (D): Injured Reserve, Knee
- Matias Maccelli (L): Injured Reserve, Maccelli
- Ryan Pulock (D): Out, Upper Body
San Jose Sharks
- Alexander Wennberg (C): Injured Reserve, Upper Body
- Igor Chernyshov (L): Injured Reserve, Upper Body
Matchup ranks
What each defense allows per game this season. Rank 1 allows the fewest, so a high number means a softer matchup for the other team’s overs.
| Islanders defense | Sharks defense | |
|---|---|---|
| Goals allowed per game | 3 (11th of 32) | 3.58 (29th of 32) |
| Shots on goal allowed per game | 28.5 (22nd of 32) | 30.11 (29th of 32) |
| Points allowed per game | 8 (10th of 32) | 9.53 (27th of 32) |
| Power-play points allowed per game | 1.5 (7th of 32) | 2.53 (23rd of 32) |
| Pace (possessions) | 53.9 (23rd) | 57.1 (5th) |
Venue and weather
Islanders vs Sharks odds by sportsbook
| Book | NYI spread | SJ spread | NYI ML | SJ ML | Over | Under |
|---|---|---|---|---|---|---|
| bet365 |
-1.5 +175 | +1.5 -210 | -139 | +119 | O 6.5 -103 | U 6.5 -117 |
| BetRivers |
-1.5 +188 | +1.5 -238 | -132 | +112 | O 6.5 +104 | U 6.5 -128 |
| Caesars |
-1.5 +170 | +1.5 -210 | -140 | +120 | O 6.5 +101 | U 6.5 -124 |
| DraftKings |
-1.5 +180 | +1.5 -218 | -142 | +120 | O 6.5 -102 | U 6.5 -118 |
 FanDuel |
-1.5 +168 | +1.5 -210 | -140 | +116 | O 6.5 -102 | U 6.5 -120 |
 Fanatics |
-1.5 +170 | +1.5 -215 | -145 | +120 | O 6.5 +100 | U 6.5 -120 |
Highlighted: the best price in each column as of 3:20 PM ET. Prices move; check the book before you bet.
Line movement from the open
| Line | Open | Now | Move |
|---|---|---|---|
| Sharks spread | +1.5 | +1.5 | – |
| Total | 6.5 | 6.5 | – |
| Islanders moneyline | -130 | -142 | +2.2% win chance |
| Sharks moneyline | +110 | +120 | -2.2% win chance |
DraftKings opening and current numbers via ESPN.
Line movement chart
More on these teams: New York Islanders stats · San Jose Sharks stats · San Jose Sharks vs Dallas Stars Nov 7 · New Jersey Devils vs New York Islanders Nov 7 · All NHL prop picks
Betting guides: NHL player props guide · NHL shots on goal strategy · NHL points props guide · how parlays work
21+. Research, not a guarantee: every bet can lose. Bet within your means; if gambling stops being fun, call 1-800-GAMBLER.
 Today's NBA picks

 Today's NFL picks

 Today's NHL picks


 Today's College Football picks

 Today's CS2 picks


 Today's LoL picks


 Today's Valorant picks


 Today's Dota 2 picks

 PHI
 BOS
 DET
 ATL
 NY
 TOR
 CLE
 MIA
 WSH
 CHA
 IND
 ORL
 BKN
 CHI
 MIL
 LAL
 OKC
 SA
 MIN
 GS
 HOU
 MEM
 POR
 DEN
 DAL
 NO
 PHX
 LAC
 SAC
 UTAH
 BUF
 DEN
 JAX
 PIT
 KC
 CIN
 NE
 CLE
 LV
 BAL
 HOU
 NYJ
 IND
 MIA
 TEN
 LAC
 SF
 MIN
 NYG
 CAR
 CHI
 DET
 GB
 SEA
 LAR
 DAL
 NO
 TB
 ATL
 ARI
 WSH
 PHI
 CAR
 BOS
 NJ
 MTL
 TB
 OTT
 NYR
 FLA
 BUF
 WSH
 TOR
 DET
 CBJ
 PIT
 PHI
 MIN
 EDM
 VGK
 DAL
 COL
 NSH
 ANA
 UTA
 SEA
 CGY
 WPG
 STL
 LA
 CHI
 VAN
 UGA
 UTAH
 ND
 UCLA
 MIA
 IU
 ALA
 TEX
 TENN
 TTU
 WAKE
 BYU
 UK
 HOU
 USC
 IOWA
 BOIS
 ORE
 MISS
 SC
 OSU
 ARIZ
 UNM
 LSU
 SMU