

NHL player props predictions today are mostly noise dressed up as analysis. Hockey is the lowest-scoring of the big four sports, roles change shift to shift, and one blocked shot can flip three props at once. That doesn’t make the market unbeatable. It makes it a market where process beats gut feel.
The method below works on any slate: classify the market, check the sample, convert the hit rate into a fair price, then shop that price across every book you can see. Nothing here is a lock. It’s a filter.
Why Hockey Props Behave Differently From Basketball Props
Hockey props are thinner markets with more moving parts. An NBA star takes 18 shots a night, so a points line has room to breathe. A top-six winger might average 2.6 shots on goal, which means an over/under at 2.5 often comes down to one puck in the third period.
Three things drive that noise:
- Ice time swings. A winger who gets 19 minutes at even strength can drop to 13 if his team takes four penalties.
- Score effects. Trailing teams push and give up shots. Leading teams tighten up and block everything. The final 10 minutes decide a lot of props.
- Assist dependency. Points and assists need a teammate to finish the play. Shots and saves don’t.
That ranking matters. Volume markets, meaning shots on goal and saves, repeat far more reliably than outcome markets like points. If you’re building a card, start where the role is stable.
How Do You Build NHL Player Props Predictions Today?
Start with the market, not the player. These four steps work on any slate, in any season, for any book.
- Classify the market. Is it a volume stat or an outcome stat? Shots on goal and saves are volume. Goals, points and assists depend on other people.
- Check the sample. Last 10 games is a starting point, never a verdict. Ask what the role looked like in those 10 games. Did he move to the top power play unit? Did his line change at the deadline?
- Convert the hit rate into a fair price. A 60% hit rate implies roughly +67. If the book pays +120, the gap is your edge. If it pays -120, there is no gap.
- Shop the number. The same prop carries different prices at different books, DFS apps and exchanges. StatsBench pulls odds from 30+ of them and shows the best available price on every prop.
Steps 1 and 2 are judgment. Steps 3 and 4 are arithmetic, and the arithmetic is free.
A Dated Example: What the Board Looked Like on November 3, 2026
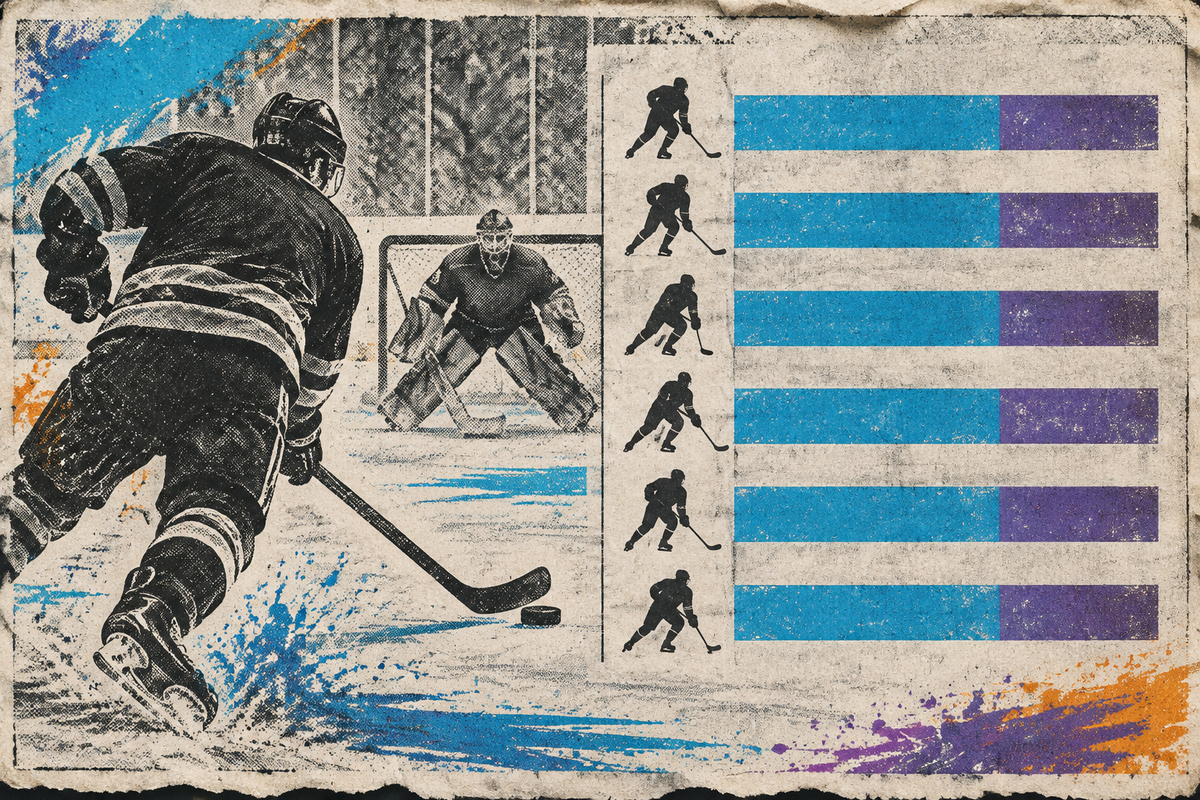
Here’s a real StatsBench snapshot from a November 3, 2026 NHL slate (Toronto vs Utah). Six props, every one of them sitting on a 6 of 10 hit rate over the last 10 games.
| Player (team) | Market | Line | Hit rate | Best price | +EV % |
|---|---|---|---|---|---|
| Darren Raddysh (TOR) | Points | 0.5 | 60% (6/10) | -120 | 0.2% |
| Darren Raddysh (TOR) | Assists | 0.5 | 60% (6/10) | +120 | 0.2% |
| William Nylander (TOR) | Shots on goal | 2.5 | 60% (6/10) | +120 | 0.3% |
| Vincent Trocheck (UTA) | Points | 0.5 | 60% (6/10) | -105 | 0.2% |
| Mikhail Sergachev (UTA) | Assists | 0.5 | 60% (6/10) | -110 | 0.2% |
| Clayton Keller (UTA) | Power play points | 0.5 | 60% (6/10) | +145 | 0.2% |
Look at the price column. Six props with an identical hit rate, priced from -120 all the way to +145. That spread is the entire lesson.
A 60% hit rate is not a 60% probability. On 10 games, the standard error is roughly 15 percentage points. So “6 of 10” fits a player who truly converts 45% of the time and a player who converts 75%. The hit rate narrows the question. It doesn’t answer it.
The +EV column is the honest tiebreaker. All six sat within 0.3% of the market price. In plain terms, the books had these numbers right and there was no free money on the board. That’s the normal outcome. Most props are priced correctly, and finding the exceptions is the work.
Best NHL Player Props: What Separates a Real Edge From a Coin Flip
The best NHL player props aren’t the longest shots or the hottest streaks. They’re the ones where a settled role meets a price the market hasn’t corrected yet.
- Stable role. Top-six forward, first power play unit, or a confirmed starting goalie. When the role is fixed, the stats repeat.
- Volume market. Shots on goal, saves and blocks land closer to a predictable spread than points do.
- A real price gap. You need a number that differs from the de-vigged market price. A great read on a fair line still loses money.
- Enough sample. Twenty games minimum for a volume stat, and more for anything that depends on teammates converting.
If a lean only clears the first two boxes, it’s a hunch with extra steps. Shot volume is the most repeatable of these markets, and our NHL shots on goal betting guide breaks down why.
DraftKings NHL Player Props: One Book Is Not the Market
DraftKings NHL player props are a single opinion. Treat that price as one data point, not the truth.
Hockey props get less attention than NBA or NFL props, so books update them more slowly and disagree more often. The gap between the best and worst price on the same line is frequently the difference between a losing bet and a break-even one.
Two habits fix this:
- Price every prop at three or more books before you commit.
- Compare the pick’em apps (PrizePicks, Underdog) against the sportsbooks. Their scoring rules differ, so read the fine print before you assume the numbers are the same bet.
StatsBench shows the best available price across 30+ sportsbooks, DFS apps and exchanges on each prop, which turns an hour of tab-switching into a single column. The market is the average of all those opinions, not any one lobby screen.
How Do You Turn a Hit Rate Into a Price?
Divide 1 by the hit rate, then subtract 1. That gives you the break-even decimal price for that percentage.
| Hit rate | Fair price | Implied probability |
|---|---|---|
| 60% | +67 | 60.0% |
| 55% | +82 | 55.0% |
| 50% | +100 | 50.0% |
| 45% | +122 | 45.0% |
Then compare the book’s number. At -110 the market needs 52.4% to break even. At +120 it needs 45.5%.
Do the conversion before you look at the price, not after. It’s easy to talk yourself into a -140 line once you’ve decided you like the player. The implied probability calculator handles the conversion in one step, and the de-vig calculator strips the book’s margin out of a two-sided market so you can see the market’s actual number. Power play markets like Keller’s deserve extra care, since a man-advantage goal is a low-frequency event by nature.
A Quick Checklist Before You Bet a Hockey Prop
Run these six questions in order. Any “no” is a reason to pass.
- Where does this player line up tonight, and has that changed in the last five games?
- Is this a volume stat or an outcome stat?
- How many games is the hit rate built on?
- What does the de-vigged price say the market believes?
- What’s the best number across the books and apps you can actually see?
- Would you still bet it if the line moved half a goal against you?
That last question filters out most bad bets before they leave your screen. If a half-goal move kills your lean, you didn’t have a lean. You had a price.
Where to Find the Numbers
Official game logs and shift data live at NHL.com, and it’s worth knowing how the power play actually converts before you bet a man-advantage prop. For everything on one screen, StatsBench covers 19 leagues including the NHL, with hit-rate charts and game logs for every player, props across every major stat, and the best price across 30+ sportsbooks, DFS apps and exchanges.
The daily write-ups live on the blog too: the NHL player props board for slate-level reads, the NHL points props guide for the hardest market to price, and the blocks props guide for the one that swings hardest with game script.
Hockey props reward patience more than most markets. Small edges, thin samples and heavy variance mean the long run is genuinely long. Bet within your means, treat it as entertainment, and if it stops being fun, 1-800-GAMBLER is there. 21+.
Frequently Asked Questions
How accurate are NHL player props predictions?
No one predicts a hockey box score reliably, and any service claiming otherwise is overselling. What you can do is measure hit rates, convert them into fair prices, and only bet when the book’s number is out of line. Over a small sample, even a real edge shows up as a coin flip.
Which NHL player props are the most predictable?
Volume markets. Shots on goal, saves and blocks repeat far better than points or assists, because they depend on one player’s role and ice time rather than a teammate finishing a pass. Start there and treat points props as the hardest market to price.
Should I compare DraftKings NHL player props to other books?
Always. A single book is one opinion, and hockey props move slower than NBA or NFL lines, so books disagree more. Pricing the same prop at three or more books (and the pick’em apps) often finds a meaningfully better number.
How many games should a hit rate cover?
Twenty games minimum for a volume stat like shots on goal, and more for anything dependent on teammates. On a 10-game sample, the error bar around a 60% hit rate is roughly 15 percentage points, which is wide enough to swallow most of an apparent edge.
Does StatsBench cover NHL player props?
Yes. StatsBench covers 19 leagues including the NHL, with hit-rate charts and game logs for every player, props across every major stat, and the best available price across 30+ sportsbooks, DFS apps and exchanges shown on each prop.
 Today's NBA picks
 Today's NFL picks
 Today's NHL picks


 Today's College Football picks

 Today's EPL picks



 Today's La Liga picks


 Today's Serie A picks



 Today's Bundesliga picks



 Today's Ligue 1 picks


 Today's EFL Championship picks


 Today's CS2 picks
 Today's LoL picks



 Today's Valorant picks
 Today's Dota 2 picks


 PHI
 DET
 BOS
 ATL
 TOR
 CLE
 NY
 WSH
 MIA
 CHA
 IND
 ORL
 BKN
 CHI
 MIL
 POR
 LAL
 HOU
 OKC
 SA
 MEM
 MIN
 GS
 DEN
 NO
 DAL
 PHX
 LAC
 UTAH
 SAC
 BUF
 DEN
 PIT
 JAX
 KC
 CIN
 NE
 CLE
 LV
 BAL
 HOU
 NYJ
 IND
 MIA
 TEN
 LAC
 SF
 MIN
 NYG
 CAR
 CHI
 DET
 GB
 SEA
 LAR
 TB
 ATL
 ARI
 DAL
 WSH
 NO
 PHI
 CAR
 BOS
 MTL
 OTT
 TB
 NJ
 FLA
 TOR
 BUF
 NYR
 DET
 WSH
 NYI
 CBJ
 PIT
 PHI
 EDM
 MIN
 VGK
 UTA
 DAL
 SEA
 COL
 NSH
 STL
 ANA
 CGY
 SJ
 WPG
 LA
 CHI
 VAN
 MIA
 UGA
 UTAH
 ND
 UCLA
 IU
 BYU
 UK
 ALA
 TEX
 OSU
 MISS
 TTU
 WAKE
 LSU
 TENN
 HOU
 USC
 MIZ
 BOIS
 IOWA
 UNM
 SC
 ARIZ
 FLA
 ARS
 MCI
 BHA
 CHE
 LIV
 BRE
 EVE
 BOU
 TOT
 AVL
 Hull City
 LEE
 NEW
 IPS
 FUL
 Coventry
 MUN
 CRY
 NFO
 SUN
 BAR
 ATM
 RMA
 BET
 RSO
 SEV
 ATH
 DEP
 VIL
 CEL
 ALA
 RAY
 GET
 ESY
 OSA
 RAC
 ELC
 LVT
 VAL
 MAL
 LAZ
 INT
 ROM
 COM
 MIL
 Frosinone
 JUV
 NAP
 BOL
 TOR
 GEN
 CAG
 ATA
 LEC
 PRM
 FIO
 SAS
 MON
 UDI
 VEN
 FCB
 BVB
 SCF
 RBL
 SVW
 B04
 SV Elversberg
 SGE
 M05
 FCA
 VFB
 TSG
 KOE
 SC Paderborn 07
 HSV
 FCU
 FC Schalke 04
 BMG
 PSG
 LOSC
 LYO
 PFC
 REN
 OM
 ASM
 NCE
 LEN
 B29
 LOR
 TOU
 STR
 AUX
 ANG
 Troyes
 Le Mans
 LEH