

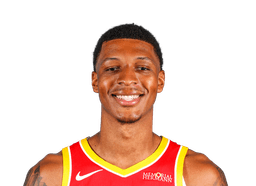
 Jabari Smith Jr.17.0 pts · 35 min
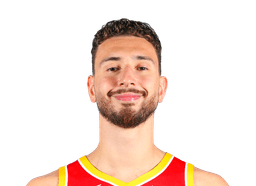 Alperen Sengun21.3 pts · 34 min
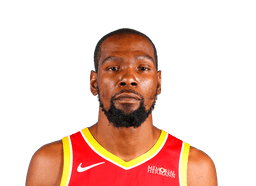 Kevin Durant21.0 pts · 34 min
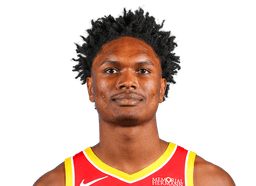 Amen Thompson14.9 pts · 33 min
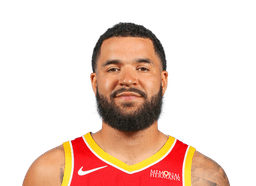 Fred VanVleet13.2 pts · 29 min
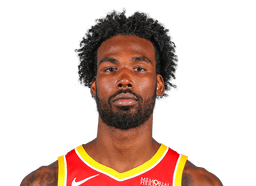 Tari Eason9.6 pts · 23 min
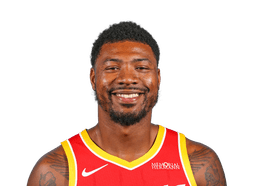 Marcus Smart8.6 pts · 22 min
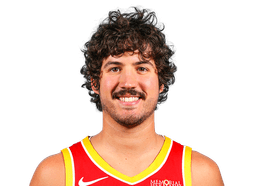 Reed Sheppard9.8 pts · 20 min
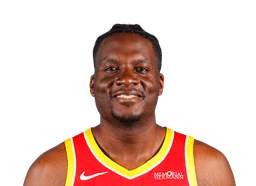 Clint CapelaOut · 3.2 pts · 14 min
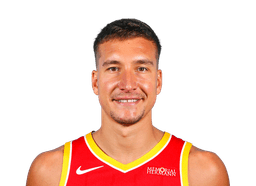 Bogdan Bogdanovic5.3 pts · 11 min
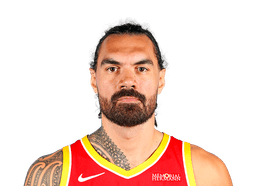 Steven AdamsOut · 4.0 pts · 8 min
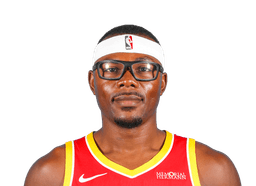 Oscar Tshiebwe2.8 pts · 7 min
Houston Rockets player stats
| Player | Pos | G | MIN | PTS | REB | AST | 3PM | STL | BLK | FG% | 3P% |
|---|---|---|---|---|---|---|---|---|---|---|---|
| Jabari Smith Jr. | PF | 11 | 34.9 | 17.0 | 6.5 | 2.4 | 2.7 | 0.9 | 0.9 | 50% | 45% |
| Alperen Sengun | C | 9 | 34.1 | 21.3 | 9.0 | 7.8 | 1.0 | 1.1 | 1.1 | 51% | 47% |
| Kevin Durant | PF | 11 | 33.7 | 21.0 | 6.3 | 3.5 | 1.4 | 0.6 | 1.4 | 50% | 36% |
| Amen Thompson | SF | 11 | 33.2 | 14.9 | 6.7 | 3.0 | 0.2 | 1.2 | 0.5 | 50% | 22% |
| Fred VanVleet | PG | 9 | 29.4 | 13.2 | 3.2 | 5.6 | 2.8 | 1.1 | 0.2 | 41% | 37% |
| Tari Eason | SF | 11 | 23.2 | 9.6 | 5.9 | 1.4 | 0.9 | 1.2 | 1.2 | 43% | 26% |
| Marcus Smart | SG | 8 | 21.5 | 8.6 | 2.6 | 2.1 | 1.8 | 1.1 | 0.1 | 42% | 37% |
| Reed Sheppard | SG | 8 | 19.8 | 9.8 | 1.8 | 2.8 | 2.3 | 1.4 | 0.0 | 37% | 32% |
| Clint Capela Out | C | 6 | 13.8 | 3.2 | 5.2 | 1.7 | 0.0 | 0.8 | 0.7 | 64% | – |
| Bogdan Bogdanovic | SG | 11 | 10.9 | 5.3 | 1.3 | 1.0 | 1.1 | 0.3 | 0.0 | 50% | 48% |
| Steven Adams Out | C | 1 | 8.0 | 4.0 | 2.0 | 1.0 | 0.0 | 0.0 | 0.0 | 100% | – |
| Oscar Tshiebwe | C | 6 | 6.7 | 2.8 | 2.0 | 0.5 | 0.0 | 0.2 | 0.3 | 89% | – |
| Isaiah Crawford | SF | 5 | 5.4 | 2.8 | 0.2 | 0.0 | 0.8 | 0.0 | 0.0 | 56% | 50% |
| Bruce Thornton | PG | 6 | 2.7 | 2.0 | 0.2 | 0.0 | 0.3 | 0.2 | 0.0 | 56% | 50% |
| Jae’Sean Tate | SF | 5 | 2.4 | 0.0 | 1.0 | 0.2 | 0.0 | 0.2 | 0.0 | 0% | 0% |
Per game, 2026-27 season. Tap a column to sort.
Where the Houston Rockets shoot
13% of their shots come from mid-range (league 10%), where they make 46.5%.
Better than the leagueWorse
| Zone | Attempts a game | Share of shots | FG% | League FG% |
|---|---|---|---|---|
| At the rim | 23.7 | 27% 16th | 68.2% 9th | 65.9% |
| Rest of the paint | 17.1 | 20% 16th | 39.9% 23rd | 44.5% |
| Mid-range | 11.5 | 13% 7th | 46.5% 4th | 40.0% |
| Corner 3 | 9.8 | 11% 19th | 32.4% 24th | 35.8% |
| Above-the-break 3 | 24.4 | 28% 25th | 39.6% 3rd | 34.5% |
Where opponents shoot against the Houston Rockets
Toughest to score on above-the-break 3 (31.2% allowed, 5th); most generous rest of the paint (50.5%, 27th).
Tougher than the leagueEasier
| Zone | Allowed a game | Share of shots | FG% allowed | League FG% |
|---|---|---|---|---|
| At the rim | 21.8 | 25% 22nd | 66.7% 18th | 65.9% |
| Rest of the paint | 18.2 | 21% 9th | 50.5% 27th | 44.5% |
| Mid-range | 9.9 | 11% 7th | 45.0% 24th | 40.0% |
| Corner 3 | 8.8 | 10% 23rd | 32.0% 6th | 35.8% |
| Above-the-break 3 | 28.3 | 32% 8th | 31.2% 5th | 34.5% |
Every field-goal attempt of the season, 11 games, by court zone. Ranks of 30: share and FG% high = 1st on offense; FG% allowed low = 1st on defense. Teal zones beat the league average for the side shown, orange ones trail it. Free throws are not field goals and are not counted.
Houston Rockets results
Won byLost by
Winning or losing margin, last 11 games.
| Date | Opponent | Result | Top scorer | |
|---|---|---|---|---|
| Nov 9 | vs DEN | W by 10 | Kevin Durant 23 | Game page |
| Nov 7 | at PHX | L by 3 | Kevin Durant 21 | Game page |
| Nov 4 | vs MIN | L by 10 | Kevin Durant 21 | Game page |
| Nov 2 | vs BOS | W by 16 | Alperen Sengun 26 | Game page |
| Oct 31 | vs OKC | W by 21 | Jabari Smith Jr. 30 | Game page |
| Oct 30 | at DAL | L by 5 | Kevin Durant 28 | Game page |
| Oct 28 | at MIL | W by 32 | Fred VanVleet 24 | Game page |
| Oct 26 | vs ATL | W by 10 | Alperen Sengun 29 | Game page |
| Oct 24 | at ATL | W by 7 | Kevin Durant 22 | Game page |
| Oct 23 | at SAS | W by 4 | Alperen Sengun 29 | Game page |
| Oct 21 | vs DAL | W by 18 | Kevin Durant 30 |
11 games this season.
Houston Rockets defense
| Per game | HOU | Rank |
|---|---|---|
| Points allowed | 106.4 | 5th of 30 |
| Defensive rating | 106.9 | 8th of 30 |
| Opponent FG% | 45.8% | 17th of 30 |
| Opponent 3P% | 31.4% | 2nd of 30 |
| Rebounds allowed | 40.0 | 1st of 30 |
| Assists allowed | 23.8 | 4th of 30 |
| 3-pointers allowed | 11.6 | 6th of 30 |
| Steals | 8.5 | 14th of 30 |
| Blocks | 5.7 | 6th of 30 |
| Turnovers forced | 15.0 | 14th of 30 |
What Houston Rockets allow by position
| Position | Points | Rebounds | Assists | 3-pointers |
|---|---|---|---|---|
| PG | 27.5 13th of 30 | 5.0 5th of 30 | 6.8 5th of 30 | 3.5 14th of 30 |
| SG | 27.2 23rd of 30 | 6.8 13th of 30 | 5.9 17th of 30 | 3.9 14th of 30 |
| SF | 25.0 13th of 30 | 9.8 10th of 30 | 4.6 9th of 30 | 2.5 4th of 30 |
| PF | 12.5 2nd of 30 | 7.4 8th of 30 | 4.4 23rd of 30 | 1.2 4th of 30 |
| C | 17.5 17th of 30 | 12.5 21st of 30 | 2.9 11th of 30 | 0.8 14th of 30 |
Ranks of 30: for anything allowed, 1st allows the fewest; for steals, blocks and turnovers forced, 1st has the most.
Houston Rockets injuries
| Player | Pos | Status | Injury | Expected back |
|---|---|---|---|---|
| Steven Adams | C | Out | Head coach Ime Udoka said Monday that Adams could return as soon as Sunday’s game at Washington, Lachard Binkley of SI.com reports. The veteran center is still recovering from a right soleus strain and hasn’t played since Oct. 23. With Adams and Clint Capela | Nov 15 |
| Clint Capela | C | Out | Head coach Ime Udoka stated Monday that Capela | Nov 15 |
| Oscar Tshiebwe | C | Day-To-Day | Tshiebwe has been ruled out for Monday’s game against the Nuggets due to an illness. With Clint Capela | Nov 11 |
Houston Rockets depth chart
| Pos | Starter | 2nd | 3rd |
|---|---|---|---|
| PG | Fred VanVleet 13.2 pts | Aaron Holiday 4.8 pts | Bruce Thornton 2.0 pts |
| SG | Marcus Smart 10.5 pts | Reed Sheppard 11.2 pts | Bogdan Bogdanovic 5.2 pts |
| SF | Amen Thompson 18.0 pts | Tari Eason 11.2 pts | Julian Phillips 3.0 pts |
| PF | Jabari Smith Jr. 17.4 pts | Kevin Durant 23.1 pts | Jeff Green 2.2 pts |
| C | Alperen Sengun 20.0 pts | Steven Adams 5.7 pts | Oscar Tshiebwe 8.4 pts |
More: NBA teams · NBA players · NBA defense vs position · NBA prop picks today · NBA starting lineups · NBA scores · NBA articles
Updated November 10, 2026.
18+, or the legal age where you live. Research, not a guarantee: every bet can lose. Bet within your means; if gambling stops being fun, contact a local support service.
Frequently Asked Questions
What is the Houston Rockets record?
8-3 in 2026-27, 7-3 in the last 10: 5-1 at home and 3-2 away.
Who leads the Houston Rockets in scoring?
Alperen Sengun, with 21.3 points a game over 9 games.
How good is the Houston Rockets defense?
They allow 106.4 points a game, 5th of 30 in the league, with a 106.9 defensive rating (8th of 30).
Where do the Houston Rockets take their shots?
28% of their field-goal attempts come from above-the-break 3, and 39% are threes. They make 39.6% from above-the-break 3 against a league average of 34.5%.
When do the Houston Rockets play next?
At home against the Golden State Warriors, Wed, Nov 11, 9:30 PM ET.