
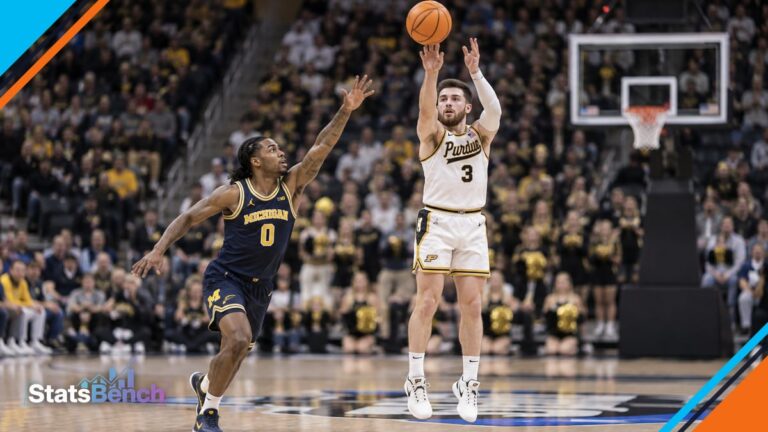
Bracketology is the practice of projecting the 68-team NCAA tournament field before the selection committee announces it. A bracketologist builds a full mock bracket, seeds every team, and flags the last few in and the first few out. The work starts in November and runs through Selection Sunday in March.
People use the word loosely. Some mean the cottage industry of bracket predictions. Others mean the study of how the committee’s decisions fit together. Either way, the goal is the same: figure out what the field will look like before it exists.
What Is Bracketology?
At its core, the job is résumé comparison. Every team builds a case across 30-plus games, and a bracketologist weighs those cases against each other to rank teams one through 68. The output looks like the bracket you fill out in March. The input is a spreadsheet of wins, losses, opponent quality, and where each game was played.
Two things separate a good projection from a lazy one:
- Knowing how the committee has actually behaved, not how you think it should behave
- Updating team résumés weekly instead of copying a bracket in February
Here’s the part people miss. A projected bracket is not a prediction of who wins the tournament. It’s a projection of who gets in and where they’re seeded. Those are completely different jobs.
How the 68-team field gets built
Thirty-two teams qualify by winning their conference tournament. Those automatic bids go out first, and they’re the reason March gets strange.
The other 36 spots are at-large bids, chosen by the selection committee. The committee ranks every team on one list, then seeds along what’s called the S-curve: the top four teams land in different regions as 1-seeds, the next four as 2-seeds, and so on down to 16.
| Route in | How many | What it means |
|---|---|---|
| Automatic bid | 32 | Conference tournament champion |
| At-large bid | 36 | Chosen and seeded by the committee |
Four of the 68 teams play in the First Four in Dayton before the main bracket starts. The other 60 go straight into the round of 64.
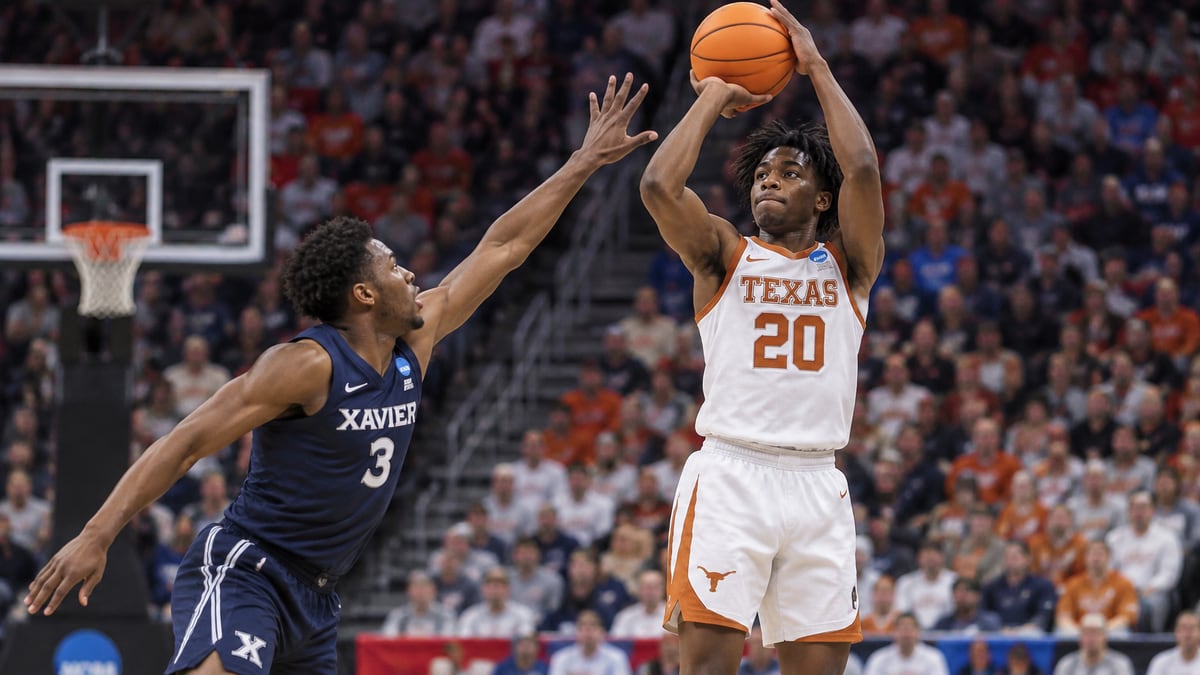
What actually goes on a résumé
The committee’s main sorting tool is the NCAA Evaluation Tool, or NET. It blends team efficiency, strength of schedule, and a results component, and it caps how much a blowout can help you. You can follow the live numbers on the NCAA’s NET rankings page.
The number quoted most often, though, is the quad record. The NCAA splits every game into four quadrants based on the opponent’s NET rank and where the game was played. Quad 1 is the top tier:
| Where the game was played | Opponent NET rank for Quad 1 |
|---|---|
| Home | 1 to 30 |
| Neutral | 1 to 50 |
| Road | 1 to 75 |
Quad 2 through Quad 4 shift those cutoffs upward tier by tier. That’s why a road game at a middling team can matter more than a home game against a similar opponent. Location changes the value of the same win.
Committee members also weigh overall strength of schedule, nonconference scheduling, road and neutral results, injuries, and late-season form. The eye test is real, but it comes after the résumé, not before it. Our guide to how the NCAA metric works goes deeper on the math, and the Quad 1 explainer covers the tier that decides most bubble cases.
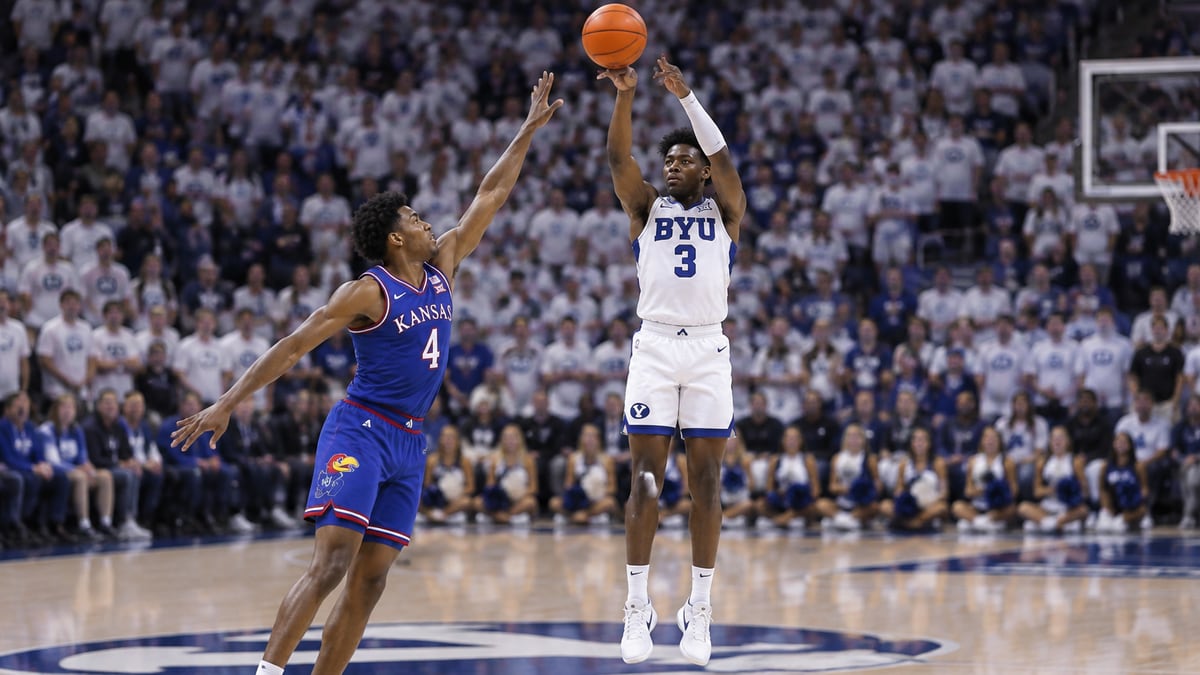
Why projected brackets move so much in March
Bid thieves. Every year a team with no at-large case wins four games in four days and takes an automatic bid. That bid has to come from somewhere, and it comes from the last at-large team in the field.
So a bracket built in February can look broken by Selection Sunday even when the bubble teams themselves did nothing wrong. Watch the smaller conference tournaments first. They produce most of the surprises, and they hit the bracket before the power leagues tip off.
The vocabulary on every bracket site
- Bubble: teams near the cut line, roughly seeds 10 through 12 plus the first few out.
- Last Four Byes: the last at-large teams that avoid Dayton.
- Last Four In: the final four at-larges, who play in the First Four.
- First Four Out: the next four teams, in order, if a spot opens up.
- Next Four Out: two rows below the cut, usually needing a run to get real.
- Bid thief: a team that wins its conference tournament and shrinks the at-large pool.
- Safe: a team that’s in regardless of what happens in its conference tournament.
If you can read those seven terms, you can read almost any bracket projection published between December and March.
Where team ratings and résumés disagree
Efficiency ratings and committee résumés answer different questions. A rating system like KenPom asks how good a team is right now, adjusted for opponent and pace. The NET asks how good the season has looked on paper. Those two lists rarely match line for line, and that gap is where most bracket arguments come from.
A team sitting 20th in an efficiency rating and 45th in the NET usually played a soft nonconference schedule, or lost its close games. The opposite case, weak rating and strong résumé, is a team that scheduled up and won a few it maybe shouldn’t have. KenPom rankings explained is the place to start if you want the rating side in detail.
How bracket context changes prop research
Projected brackets are a team-level exercise, but they change how you read player props in February and March.
- A bubble team has every reason to ride its starters for heavy minutes. That lifts usage and counting stats.
- A team safely in the field may manage minutes in a conference tournament game that can’t improve its seed.
- Neutral-site games, which take over in March, remove home-scoring quirks from the sample.
None of that is a bet on its own. It’s context that changes what a normal line looks like for a given player.
StatsBench’s NCAAB prop board shows hit rates and the best price across 30+ sportsbooks, DFS apps and exchanges, so you can check whether the market has already adjusted. A snapshot from a November 2026 slate: Jake Fiegen’s points line at 10.5 had hit in 9 of 10 games (90%) at a best price of -110, Tariq Francis’s points plus assists at 14.5 was 8 of 10 (80%) at -140, and Isaiah Malone’s rebounds at 5.5 was 7 of 10 (70%) at +102. Three different records, three different prices. The 70% row is the only one paying plus money, which tells you the matchup, not the raw hit rate, is doing the work in that price.
November is also the roughest stretch for this. The NCAA doesn’t publish its first NET rankings until December, so early projections lean on other ratings and on nonconference schedules that haven’t played out. Early bracket work is about tracking, not concluding.
What bracketology can’t tell you
It won’t pick a champion. It won’t tell you a 12-seed beats a 5-seed. And it carries no predictive edge on a single game, because the committee’s ranking and a team’s actual strength are two different measurements that happen to share a name.
Treat a projection as a map of the field, not a forecast of results. If you’re using any of this to bet, the usual rules apply: 21+, prices move while you’re reading, and a long-run edge shows up over hundreds of bets or not at all. The history of the term is a fun sidebar if you want to know how a word from the 1980s ended up on every sports site in March.
Free preview
See today’s college basketball player props on StatsBench
Live lines, hit rates and the best price across 30+ books and pick’em apps. A free preview shows today’s first props; a free account shows more.
Open the college basketball player props board →
Prefer email? Get the daily picks newsletter.
Frequently Asked Questions
What does bracketology actually mean?
It’s the practice of projecting the NCAA tournament field before the selection committee releases it. A bracketologist seeds all 68 teams and identifies the last at-larges in and the first few out. It’s a projection of the field, not a prediction of game results.
Does bracketology use KenPom?
Serious bracketologists use both. KenPom and similar ratings measure how strong a team is right now, adjusted for opponent and pace. The committee’s own NET and quad records measure how the season looks on paper. The two often disagree, and those disagreements drive most bracket debate.
How many teams get into the NCAA tournament?
Sixty-eight. Thirty-two get in by winning their conference tournament, and the committee selects 36 at-large teams. Four of the 68 play in the First Four in Dayton before the round of 64.
When do bracket projections become reliable?
Later than most people think. November brackets are rough because the NCAA doesn’t publish its first NET rankings until December and nonconference schedules are still sorting out. Projections tighten through January and usually settle by mid-February, before conference tournament upsets start moving the cut line.
What is a bid thief in March?
A team that wins its conference tournament and takes an automatic bid it wasn’t projected to get. That extra automatic bid shrinks the at-large pool by one, which usually knocks the last team in the field out of the bracket on Selection Sunday.
 Today's NBA picks



 Today's NFL picks

 Today's NHL picks



 Today's College Football picks



 Today's College Basketball picks

 Today's CS2 picks



 Today's Valorant picks


 Today's Dota 2 picks



 PHI
 BOS
 DET
 MIA
 ATL
 NY
 CLE
 ORL
 TOR
 IND
 CHA
 WSH
 BKN
 CHI
 MIL
 SA
 LAL
 HOU
 MIN
 MEM
 POR
 OKC
 DEN
 GS
 DAL
 PHX
 NO
 LAC
 SAC
 UTAH
 BUF
 KC
 JAX
 CIN
 DEN
 PIT
 CLE
 NE
 LV
 BAL
 HOU
 IND
 NYJ
 LAC
 MIA
 TEN
 SF
 DET
 NYG
 CAR
 MIN
 CHI
 GB
 SEA
 LAR
 DAL
 WSH
 TB
 NO
 ATL
 ARI
 PHI
 CAR
 NJ
 TB
 OTT
 MTL
 BOS
 NYR
 FLA
 NYI
 WSH
 BUF
 DET
 TOR
 PHI
 PIT
 CBJ
 EDM
 MIN
 VGK
 COL
 NSH
 DAL
 ANA
 WPG
 UTA
 SJ
 STL
 SEA
 CGY
 LA
 CHI
 VAN
 UGA
 UTAH
 ND
 UCLA
 MIA
 IU
 ALA
 TEX
 TENN
 WAKE
 TTU
 BYU
 IOWA
 ORE
 BOIS
 OSU
 UK
 USC
 ARIZ
 HOU
 LOU
 LIB
 FLA
 MEM
 MISS
 MSU
 CONN
 UVA
 DUKE
 ILL
 KU
 SJU
 VAN
 MICH
 ARK
 GONZ
 NEB
 LSU
 Premier League table
 ARS
 BHA
 MCI
 LIV
 CHE
 EVE
 BOU
 BRE
 LEE
 AVL
 TOT
 NEW
 Hull City
 IPS
 FUL
 NFO
 Coventry
 MUN
 SUN
 CRY
 La Liga table
 BAR
 RMA
 ATM
 BET
 RSO
 SEV
 ATH
 VIL
 DEP
 RAC
 CEL
 ALA
 ESY
 RAY
 GET
 OSA
 LVT
 ELC
 VAL
 MAL
 Serie A table
 LAZ
 INT
 ROM
 MIL
 COM
 Frosinone
 JUV
 BOL
 CAG
 NAP
 TOR
 ATA
 GEN
 LEC
 FIO
 PRM
 SAS
 MON
 VEN
 UDI
 Bundesliga table
 FCB
 BVB
 SCF
 RBL
 B04
 SVW
 SV Elversberg
 VFB
 TSG
 SGE
 HSV
 M05
 SC Paderborn 07
 FCA
 KOE
 FCU
 FC Schalke 04
 BMG
 Ligue 1 table
 PSG
 LOSC
 PFC
 OM
 LYO
 NCE
 ASM
 REN
 B29
 LOR
 LEN
 TOU
 STR
 AUX
 Le Mans
 ANG
 Troyes
 LEH