
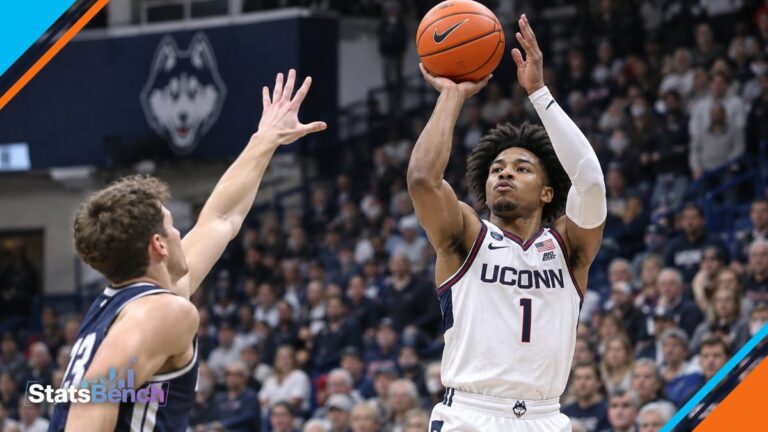
An NCAAB computer pick is a model’s projected number compared with the line a sportsbook posts. That’s the whole idea. The model projects a guard for 14.6 points, the book hangs 12.5, and the pick is over. The math is the easy part. Deciding whether the projection deserves your money is the job.
What NCAAB Computer Picks Actually Are
A computer pick is the output of a model, not a person. You feed it box scores, pace, opponent strength and minutes. It returns a number. When that number lands far enough from the posted line, the model flags a pick.
Two flavors dominate the market. Player props (points, rebounds, threes, turnovers) and team markets (spread, total). The logic is identical: estimate the true distribution, compare it to the price, and only act when the gap is wide enough to survive the vig. The same machinery drives spread and total selections, though props are where the inputs are cleanest.
What a computer pick is not: a promise. A model that says a player clears a line 60% of the time will be wrong four times in ten, and it will lose twice in a row plenty. Any site that frames a model output as certain is selling you something else.
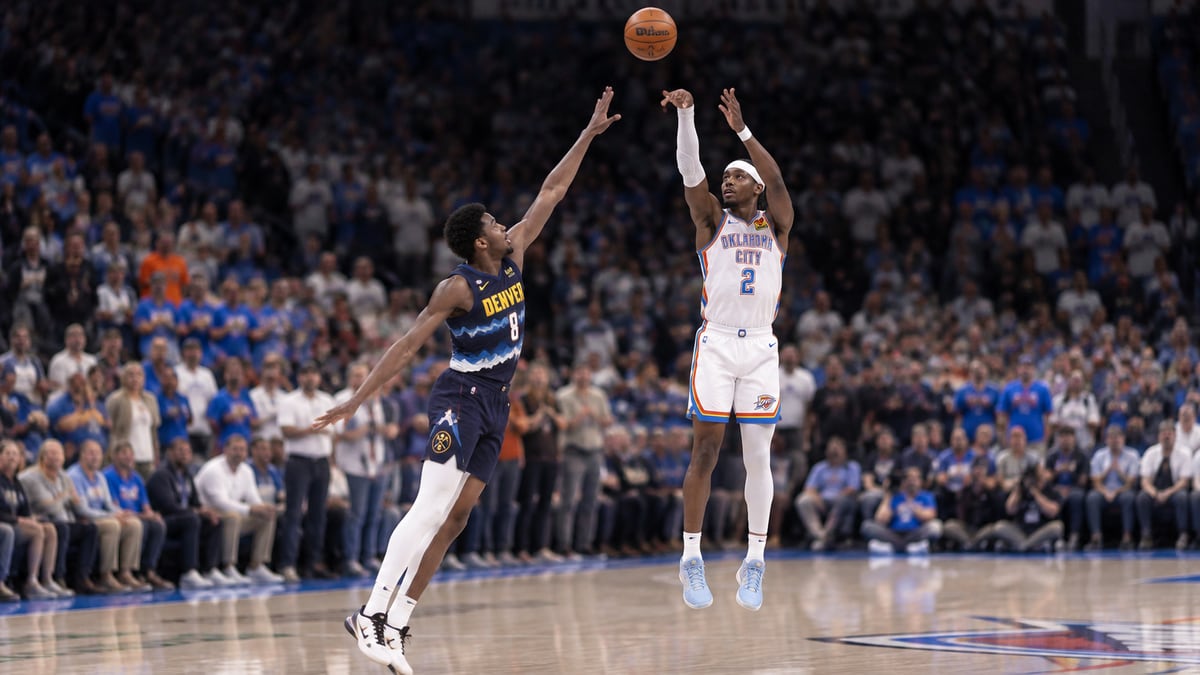
What goes into a college basketball model
Good college models lean on a handful of inputs that genuinely move a stat line. These are the ones that matter for props.
- Pace and possessions. A team playing 78 possessions a game hands out more rebound and assist chances than one playing 66.
- Minutes and role. A 30-minute starter and a 22-minute reserve can share a per-40 rate and produce completely different lines.
- Offensive efficiency and shot profile. Usage tells you who shoots. Efficiency tells you whether those shots go in.
- Opponent defense and positional matchup. A rim protector changes a guard’s floater game, not just his points line.
- Game script. A big spread means fewer minutes for starters, and a blowout can erase a fourth-quarter stat line entirely.
Notice what’s missing from that list: reputation. Efficiency ratings and the official NCAA stats pages give a model a baseline, but the projection only sharpens when minutes and matchups are current. A model that still thinks a transferred wing is a bench player will post bad numbers for a month.
Why November breaks more models than March does
The short answer: tiny samples and new rosters. College basketball in November is a different sport from the one models spent the offseason studying.
Three things go wrong at once.
- Roster turnover. Transfers and freshmen change usage, spacing and defensive assignments. Preseason priors are guesses dressed up as data.
- Buy games. A 30-point win over an overmatched opponent tells the model almost nothing about how a player performs against a conference defense.
- Minute instability. Coaches tinker with rotations early. A player at 26 minutes one night and 17 the next wrecks any projection built on averages.
The sample problem is the one that bites hardest. A 9/10 record built over two months of conference play tells you more than a 9/10 built over three weeks of guarantee games, and the record alone does not tell you which one you’re looking at. Look at the calendar. Sample size in betting covers how much history you actually need before a rate means anything.
Take a dated example. In a snapshot from a mid-November 2026 NCAAB slate, StatsBench showed Thomas Dowd rebounds over 7.5 at 9/10 with a best price of -114, and Tomislav Buljan rebounds over 6.5 at 10/10 at a best -141. Both were real records on the same board, compiled while the season was young. The interesting question is not which record looks prettier. It’s whether the opponent and the minutes support the same number again.
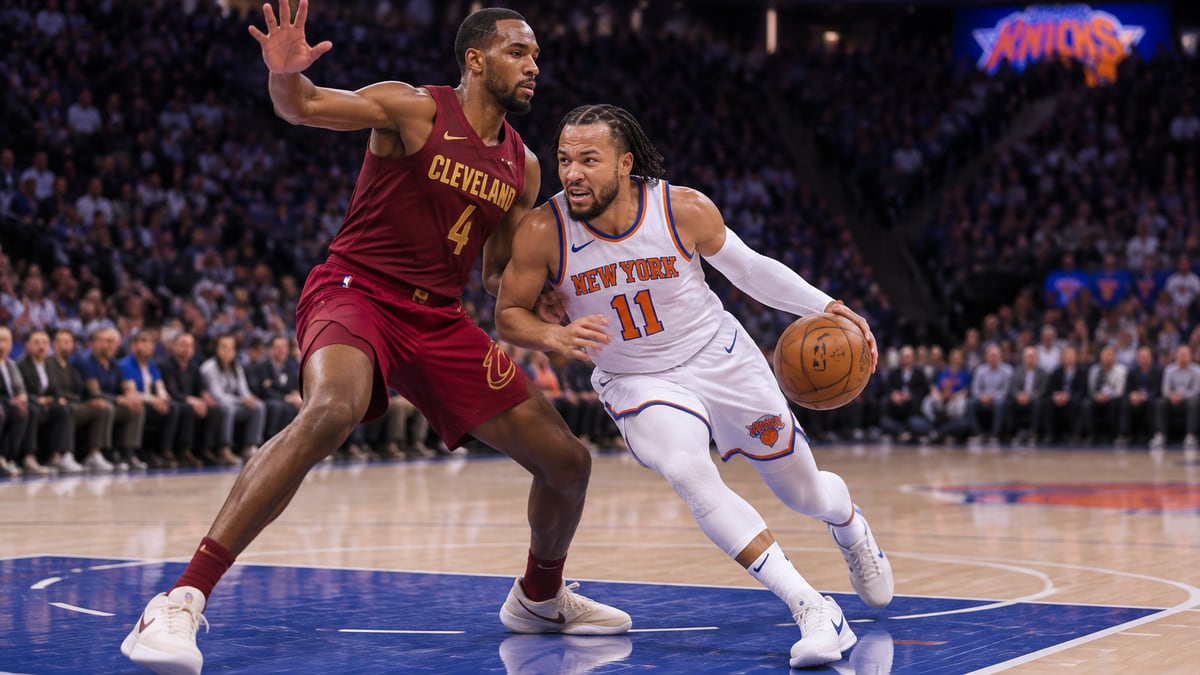
Hit rate vs projection: which number do you trust?
Neither one on its own. A projection looks forward. A hit rate looks backward. They answer different questions, and the market price sits between them.
Here is a strength-ranked selection from a mid-November 2026 NCAAB slate in StatsBench’s prop finder. Every rate ships with its record, and the price shown is the best available across the books StatsBench tracks. It’s a ranked list, not a random slice of the market.
| Player | Market | Record | Best price |
|---|---|---|---|
| John Mobley Jr. (OSU at CONN) | Threes over 1.5 | 10/10 | -235 |
| Jeremy Fears Jr. (MSU vs UNI) | Turnovers over 2.5 | 10/10 | +102 |
| Thomas Dowd (AUB vs ARIZ) | Rebounds over 7.5 | 9/10 | -114 |
| Darin Smith Jr. (RUTG vs BRY) | Pts + rebs + asts over 15.5 | 9/10 | -120 |
| Tomislav Buljan (MD vs UVA) | Rebs + asts over 8.5 | 8/10 | +100 |
| A’lahn Sumler (PITT at BUT) | Threes over 1.5 | 8/10 | -145 |
Read that price column before the record column. Threes over 1.5 at -235 needs to cash just north of 70% of the time to break even. A turnovers over 2.5 at +102 breaks even near 49.5%. Same 10/10 label, wildly different bars to clear. The implied probability calculator converts any price in one step so you’re never guessing.
This is also why an 8/10 at plus money can be more appealing than a 9/10 laying -120, depending on what the matchup does to the projection. Record and price have to be read together. Hit rate vs edge digs into that relationship, and it’s where most of the work happens.
How to vet a computer pick before you bet
Run five checks. If a pick fails two of them, pass, no matter how clean the record looks.
- Sample and date. How many games, and how recent? A rate built before conference play is a different animal.
- The opponent. Does the defense allow the shot this prop depends on? Does the pace add or subtract possessions?
- Minutes and role. Check the depth chart and injury report. Foul trouble risk on a thin frontcourt matters.
- Price across books. A quarter-point of juice is real money over a season. Compare, don’t accept the first number you see.
- Game script. A lopsided spread means starters sit. Props tied to volume get squeezed.
The method doesn’t change by sport, only the inputs do. The same vetting routine that works for college football computer picks applies here with basketball-specific checks for pace and minutes.
How StatsBench’s projections and hit rates fit
StatsBench is a research desk, not a picks service. For college basketball, the NCAAB prop finder (free account required) lets you filter the day’s props, then see each player’s hit rate with the record attached and game logs behind it. Every prop carries an SB Score and a projection, plus a +EV percentage you can sort by when you want to scan for the biggest gap between model and market.
The other half is price. StatsBench compares the best available number across 30+ sportsbooks, DFS apps and exchanges, which matters because the difference between -114 and -135 is the difference between a bet and a habit. Across a season, in-season volume runs 10,000+ props a day across 19 leagues.
For the wider picture, the college basketball stats hub collects the guides, and the daily college basketball prop picks page shows how these numbers get applied to a real slate when a human does the filter work and places the bet.
One honest note before you go. A projection is an estimate, and any edge is long run. Bet within your means, 21+ where legal, and if it stops being fun, call 1-800-GAMBLER.
Free preview
See today’s college basketball player props on StatsBench
Live lines, hit rates and the best price across 30+ books and pick’em apps. A free preview shows today’s first props; a free account shows more.
Open the college basketball player props board →
Prefer email? Get the daily picks newsletter.
Frequently Asked Questions
What are NCAAB computer picks?
They are model outputs, not human opinions. A model projects a player’s or team’s stat line, compares that projection to the posted number, and flags a pick when the gap is wide enough to justify the price. The projection is an estimate with a probability attached, not a forecast that will always land.
Are college basketball models less reliable in November?
Usually, yes. Rosters turn over, rotations are unsettled and the schedule is full of mismatches that tell a model very little. A 9/10 or 10/10 record built in late November covers a small, strange sample, so read the record next to the calendar and the opponent.
How many games should a hit rate cover before I use it?
More than a handful. Ten games can be a useful starting point for spotting a role, but it is thin evidence on its own. Check whether the stretch includes real competition, whether minutes were stable, and whether the line has moved since. A rate is context, not a verdict.
Do computer picks work for spreads and totals too?
The same math applies, just with team-level inputs like pace, efficiency and rest instead of individual stats. Player props tend to be cleaner to model because the inputs are narrower, while spreads carry more noise from game script and late lineup news.
Where can I see NCAAB projections and hit rates in one place?
StatsBench’s NCAAB prop finder shows player hit rates with their records and game logs, plus an SB Score and projection on each prop and the best available price across the books it tracks. A free account unlocks the board; pricing tiers add the full prop research tools.
 Today's NBA picks

 Today's NFL picks
 Today's NHL picks



 Today's College Football picks


 Today's College Basketball picks

 Today's CS2 picks


 Today's Valorant picks


 Today's Dota 2 picks



 PHI
 BOS
 DET
 MIA
 ATL
 NY
 CLE
 ORL
 TOR
 IND
 CHA
 WSH
 BKN
 CHI
 MIL
 SA
 LAL
 HOU
 MIN
 MEM
 POR
 OKC
 DEN
 GS
 DAL
 PHX
 NO
 LAC
 SAC
 UTAH
 BUF
 KC
 JAX
 CIN
 DEN
 PIT
 CLE
 NE
 LV
 BAL
 HOU
 IND
 NYJ
 LAC
 MIA
 TEN
 SF
 DET
 NYG
 CAR
 MIN
 CHI
 GB
 SEA
 LAR
 DAL
 WSH
 TB
 NO
 ATL
 ARI
 PHI
 CAR
 NJ
 TB
 OTT
 MTL
 BOS
 NYR
 FLA
 NYI
 WSH
 BUF
 DET
 TOR
 PHI
 PIT
 CBJ
 EDM
 MIN
 VGK
 COL
 NSH
 DAL
 ANA
 WPG
 UTA
 SJ
 STL
 SEA
 CGY
 LA
 CHI
 VAN
 UGA
 UTAH
 ND
 UCLA
 MIA
 IU
 ALA
 TEX
 TENN
 WAKE
 TTU
 BYU
 IOWA
 ORE
 BOIS
 OSU
 UK
 USC
 ARIZ
 HOU
 LOU
 LIB
 FLA
 MEM
 MISS
 MSU
 CONN
 UVA
 DUKE
 ILL
 KU
 SJU
 VAN
 MICH
 ARK
 GONZ
 NEB
 LSU
 Premier League table
 ARS
 BHA
 MCI
 LIV
 CHE
 EVE
 BOU
 BRE
 LEE
 AVL
 TOT
 NEW
 Hull City
 IPS
 FUL
 NFO
 Coventry
 MUN
 SUN
 CRY
 La Liga table
 BAR
 RMA
 ATM
 BET
 RSO
 SEV
 ATH
 VIL
 DEP
 RAC
 CEL
 ALA
 ESY
 RAY
 GET
 OSA
 LVT
 ELC
 VAL
 MAL
 Serie A table
 LAZ
 INT
 ROM
 MIL
 COM
 Frosinone
 JUV
 BOL
 CAG
 NAP
 TOR
 ATA
 GEN
 LEC
 FIO
 PRM
 SAS
 MON
 VEN
 UDI
 Bundesliga table
 FCB
 BVB
 SCF
 RBL
 B04
 SVW
 SV Elversberg
 VFB
 TSG
 SGE
 HSV
 M05
 SC Paderborn 07
 FCA
 KOE
 FCU
 FC Schalke 04
 BMG
 Ligue 1 table
 PSG
 LOSC
 PFC
 OM
 LYO
 NCE
 ASM
 REN
 B29
 LOR
 LEN
 TOU
 STR
 AUX
 Le Mans
 ANG
 Troyes
 LEH