
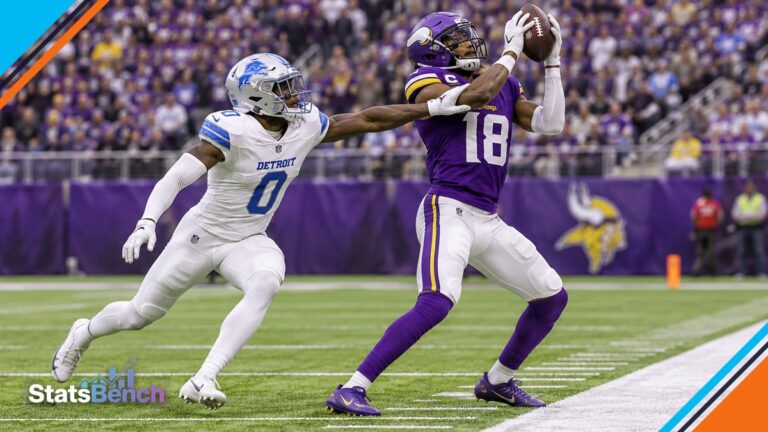
FanDuel NFL player props are single-player markets: a receiver’s yardage, a quarterback’s touchdown passes, a kicker’s field goals. You’re betting on one stat line, not on who wins the game. The research decides whether the price is worth it.
Here’s the part most bettors skip. FanDuel posts one number. Another book posts a different one on the same player. A prop research tool puts those prices side by side, adds the player’s hit rate and game log, and lets you decide with actual information instead of a gut feel. That’s the workflow below. None of it promises a win. 21+, and only bet what you can afford to lose.
What Markets Does FanDuel Post for NFL Player Props?
FanDuel covers the full NFL prop menu: passing yards and passing touchdowns, rushing yards and attempts, receptions and receiving yards, longest reception, kicking points, field goals made, plus tackles and sacks on the defensive side.
Lines are set per player, per game, and they move through the week as news lands. A receiver listed as questionable on Wednesday can carry a very different number by Sunday morning. That’s normal, and it’s one reason a screenshot of a line is close to useless the next day.
StatsBench pulls props from its own odds feed, which covers 30+ sportsbooks, DFS apps like PrizePicks and Underdog, and exchanges. In season that’s 10,000+ props a day across 19 leagues, NFL included. FanDuel is one row in that grid, not the whole picture.
Why the FanDuel Price Is Only Half the Answer
Two books can disagree on the same prop and both stay in business. That gap is the cheapest edge in betting, and it costs you nothing to take.
Say one book prices a player’s over at -120 and another has the same over at -105. Convert those to implied probability and you get roughly 54.5% versus 51.2%. Same player, same stat, same game, meaningfully different cost. Across a season of props, that difference is the whole ballgame.
Type a price into the implied probability calculator and you get the percentage back. Do it a dozen times and you’ll start eyeballing price gaps without the tool.
How to Research FanDuel NFL Player Props in Four Steps
The process is short. It just has to be repeatable, because you’ll run it on a lot of props.
Step 1: Pull the prop into a filterable board
Open the NFL prop finder and filter down to the market you care about. Receiving yards, kicker points, whatever it is. The point is to see every version of that market in one place instead of clicking through six sportsbook apps in six tabs.
Step 2: Read the hit rate with its record
StatsBench shows each prop with a hit rate and the record behind it. Read them together, always. “90%” on its own tells you nothing. “90%, 9 of 10” tells you the sample, and a 10-game sample in the NFL is thin.
Then ask what those ten games had in common. Same role? Same quarterback? Same target share? A hit rate describes the past. It doesn’t forecast anything.
Step 3: Price it across books, DFS apps and exchanges
This is where the tool earns its keep. Every prop shows the best available price across the books, the pick’em apps and the exchanges. If FanDuel holds the best number, bet FanDuel. If it doesn’t, you just saved money on a bet you were going to make anyway.
Step 4: Convert the odds and check the implied number
Before you tap place bet, run the price through the odds converter so you know the percentage. Run it through the vig calculator if you want to see what the book is charging across both sides. Backing an over without knowing the implied probability is guessing with extra steps. If “vig” is a new word, the basic definition is worth two minutes.
Player Props NFL: What a Real Board Looks Like
Here’s a dated snapshot from a November 2026 NFL slate, pulled from StatsBench. These are strong rows from that board rather than the entire board. The interesting part is the shape of the numbers.
| Player (team) | Prop | Line | Hit rate (record) | Best price |
|---|---|---|---|---|
| Ben Sinnott (WSH at NYG) | Longest reception | Over 0.5 | 100% (10/10) | +169 |
| Theo Johnson (NYG vs WSH) | Longest reception | Over 7.5 | 100% (10/10) | -105 |
| Matt Gay (LV vs SEA) | Kicking points | Over 4.5 | 100% (10/10) | -122 |
| Michael Mayer (LV vs SEA) | Receiving yards | Over 21.5 | 90% (9/10) | -111 |
| Tre Tucker (LV vs SEA) | Longest reception | Over 15.5 | 90% (9/10) | -109 |
| Van Jefferson (WSH at NYG) | Longest reception | Over 7.5 | 90% (9/10) | -108 |
| Jordan Love (GB vs MIN) | Passing yards | Over 255.5 | 80% (8/10) | -110 |
| Quinshon Judkins (CLE vs HOU) | Receiving yards | Over 5.5 | 80% (8/10) | -111 |
| Jared Goff (DET vs NE) | Longest rush | Over 0.5 | 80% (8/10) | -122 |
Two rows are worth a closer look.
Ben Sinnott at +169 on a 10/10 record is the row that makes people stop scrolling. A plus price on a market that has hit every time sounds like a mistake. It isn’t. Longest reception over 0.5 needs one catch, and the plus price tells you the market doesn’t expect many targets. The record is real. So is the reason the number is generous.
Michael Mayer’s receiving yards line sits at 21.5 with a 9/10 record and a best price of -111. That’s a modest number for a tight end, priced near a coin flip. Jordan Love’s passing yards at 255.5 with an 8/10 record is the same story in a much bigger market: the price is close to even because the line is set well.
Notice the records run from 10/10 down to 8/10. If every row on the page shows the same hit rate, you’re looking at a filter, not a board.
DraftKings Player Props vs FanDuel: Where the Prices Split
FanDuel and DraftKings usually land close on the mainstream markets. The wider gaps tend to show up on thinner props: kicker points, longest reception, a third receiver’s yardage, defensive tackle counts. Those are the markets where each book sets its own number and doesn’t mind being an outlier.
That’s an argument for checking both, not for pledging loyalty to one. The DraftKings NFL props comparison walks the same workflow from the other side of the aisle.
If your slip mixes books, run the legs through the parlay calculator first. Correlated legs price differently than straight multiplication suggests, and it’s better to find that out before you submit.
The Calculator Layer: What the Tools Actually Do
The calculators are the interactive part of this workflow. They take the arithmetic off your plate and turn a price into something you can compare.
- Implied probability: American odds into a percentage you can weigh against your own estimate.
- Odds converter: American, decimal and fractional formats in one place.
- Vig / hold: what the book is charging across both sides of a market.
- De-vig: strip the juice out to get a fair line. The de-vig tool does it in one step.
- EV: expected value of a bet given the probability you assign it.
- Parlay and payout: what a slip actually returns before you build it.
None of these tell you which side to take. They tell you what the price means. That distinction matters. A tool that flags a bet as +EV is only as good as the probability you fed into it.
Sorting by Best EV vs Sorting by Hit Rate
Every prop in the player view shows a +EV % for the over and the under, and the board can be sorted by Best EV. That’s a different lens than hit rate, and the two disagree constantly.
A player can hit 9 of 10 and still be a poor bet at -260. Another can hit 6 of 10 and be worth a look at +140. Hit rate measures how often something happened. The +EV % measures whether the offered price is better than the chance it happens again. You need both to decide, and StatsBench shows both without asking you to build a spreadsheet.
One caution. +EV is a long-run idea. It means the price sits in your favor over a large sample, not that the bet cashes this week. Plenty of +EV bets lose. That’s variance, and pretending otherwise would be selling you something.
Sample Size, Variance, and Reading a 10/10 Honestly
Ten games is a small slice of an NFL season. A 10/10 record on a longest-reception prop can reflect a genuine role change, or ten games where the player saw exactly one target and caught it. Very different situations, identical hit rate.
So open the game log. Official stat lines live at NFL.com, and StatsBench shows the same logs next to the prop. If a player cleared comfortably in eight of ten, the rate carries weight. If four of the ten were squeakers, it doesn’t.
Check the matchup too. Defensive rankings against the position, depth charts and injury reports all move what a prop is worth. Those inputs are what separates research from scrolling.
A Short Slate Changes the Math
On a Sunday with a full card, you have hundreds of props to sort and you can afford to be picky. On a Monday with one game, the board is thin and the books know it. Fewer markets, tighter prices, more attention on every line.
The MNF player props guide digs into that specific problem. The short version: on a single-game slate, price matters more than usual, and the prop you liked at -110 on Sunday might be -125 by Monday night.
Putting the Workflow Together
A repeatable process beats a hot take. Filter the NFL board, read the hit rate with its record, find the best price across 30+ books and the pick’em apps, then convert the odds so you know the percentage. Four steps, ten minutes, and you’re making a decision instead of a guess.
For live numbers on the current slate, the weekly NFL player props page is where the data lands. For the fundamentals of reading a price, the guide to how to read player prop odds is the primer. And for the board itself, the NFL prop finder is the starting point. A free StatsBench account opens the board; Premium unlocks the full filter set across 10,000+ daily props.
Free preview
See today’s NFL player props on StatsBench
Live lines, hit rates and the best price across 30+ books and pick’em apps. A free preview shows today’s first props; a free account shows more.
Open the NFL player props board →
Prefer email? Get the daily picks newsletter.
Frequently Asked Questions
Is FanDuel good for NFL player props?
FanDuel posts a full menu of NFL props, from passing yards to kicker points, and the lines move through the week as news lands. It’s a solid board. The catch is that it’s one book, so the smart move is checking its price against the rest of the market before you bet.
How do I find the best price on an NFL player prop?
Compare the same prop across multiple books, DFS apps and exchanges, then take the highest number on the side you want. A 15-cent gap on the same player is real money over a season. StatsBench shows the best available price on every prop in its feed.
What does +EV mean on a player prop?
It’s the expected value of the bet at the offered price, based on the probability behind it. A positive number means the price pays more than the chance of the outcome, over a large sample. It never means the bet wins this week.
Are NFL player props riskier than spread bets?
They’re different, not automatically riskier. Props on thin markets like longest reception or kicker points carry more variance because a single catch or kick decides them. Mainstream markets such as passing yards behave more like a game total.
How many games should a hit rate cover?
Ten games is a starting point, not proof. Read the record alongside the game log and ask whether the player cleared comfortably or by a hair. A 10/10 built on one-target games is a much weaker signal than a 10/10 built on steady volume.
 Today's NBA picks



 Today's NFL picks


 Today's NHL picks



 Today's College Football picks

 Today's CS2 picks

 Today's LoL picks

 Today's Valorant picks

 Today's Dota 2 picks



 BOS
 PHI
 DET
 ATL
 NY
 CLE
 TOR
 MIA
 CHA
 ORL
 IND
 WSH
 BKN
 CHI
 MIL
 LAL
 SA
 HOU
 POR
 MIN
 GS
 OKC
 DAL
 MEM
 DEN
 PHX
 NO
 LAC
 SAC
 UTAH
 BUF
 DEN
 JAX
 PIT
 KC
 CIN
 NE
 CLE
 LV
 BAL
 HOU
 NYJ
 IND
 MIA
 TEN
 LAC
 SF
 CHI
 NYG
 CAR
 DET
 MIN
 GB
 SEA
 LAR
 DAL
 NO
 TB
 ATL
 ARI
 WSH
 PHI
 CAR
 BOS
 TB
 MTL
 NJ
 OTT
 NYR
 FLA
 WSH
 BUF
 NYI
 TOR
 DET
 PIT
 PHI
 CBJ
 EDM
 MIN
 VGK
 NSH
 COL
 DAL
 ANA
 UTA
 SEA
 WPG
 STL
 SJ
 CGY
 LA
 CHI
 VAN
 UGA
 UTAH
 ND
 UCLA
 MIA
 IU
 ALA
 TEX
 TENN
 TTU
 WAKE
 BYU
 UK
 HOU
 USC
 IOWA
 BOIS
 ORE
 MISS
 SC
 OSU
 ARIZ
 UNM
 LSU
 SMU