


Final score by period
| Team | 1 | 2 | 3 | T |
|---|---|---|---|---|
| Predators |
0 | 1 | 1 | 2 |
| Sharks |
2 | 1 | 1 | 4 |
How the bets settled
Closing line, DraftKings.
Game review
San Jose beat Nashville 4-2, and the game swung in a two-goal Sharks first period that left the Predators chasing the rest of the way. Nashville answered once in the second and once in the third, but San Jose matched each response to keep control.
Will Smith led the Sharks with a goal and two assists. Nils Hoglander scored for Nashville, while Filip Forsberg and Steven Stamkos each recorded a point. San Jose blocked 16 shots and had a 5-3 takeaway edge, helping protect the lead even as Nashville won 58.2 percent of faceoffs and converted 33.3 percent of its power plays.
For bettors, San Jose covered the 1.5-goal closing spread by 3.5, and the game finished under the 6.5 closing total by 0.5.
How our picks did
- Ross Colton OVER 1.5 SOG (-125): pending
The poster on X · Every posted pick, graded
How the props finished
5 of 10 cleared
| Player | Line | Price | Result |
|---|---|---|---|
 Ross Colton |
Over 1.5 shots on goal | -123  prophetexchange |
1 Missed |
 Adam Edstrom |
Over 2.5 hits | -137  Stake |
3 Cleared |
 Kiefer Sherwood |
Over 3.5 hits | -143  Cloudbet |
2 Missed |
 Alex Nedeljkovic |
Over 24.5 saves | -101 prophetexchange |
32 Cleared |
 Macklin Celebrini |
Over 3.5 shots on goal | -105  Hard Rock |
5 Cleared |
 Roman Josi |
Over 0.5 assists | -139  BetMGM |
0 Missed |
 Steven Stamkos |
Over 0.5 points | -194  Kalshi |
1 Cleared |
 Filip Forsberg |
Over 0.5 points | -212 Kalshi |
1 Cleared |
 Juuse Saros |
Over 24.5 saves | -102  FanDuel |
20 Missed |
 Tyler Toffoli |
Over 1.5 shots on goal | -128 BetMGM |
0 Missed |
Each player’s top line by recent hit rate before the game, graded against the box score. These are research lines, not posted picks.
Against the spread, start to finish
Top performers
Predators
 GoalsNils Hoglander1
 AssistsFilip Forsberg1
 PointsSteven Stamkos1
Sharks
 GoalsWill Smith1
- AssistsWill Smith2
- PointsWill Smith3
Team stats
PredatorsSharksBox score
Nashville Predators
Forwards
| Player | G | A | SOG | S | +/- | TOI | SHFT | HT | BS | TK | GV | PIM | FO% |
|---|---|---|---|---|---|---|---|---|---|---|---|---|---|
 Mavrik Bourque C |
0 | 0 | 0 | 3 | -3 | 12:46 | 16 | 2 | 0 | 1 | 1 | 0 | 0.0 |
| Ross Colton C |
0 | 0 | 0 | 1 | -1 | 11:34 | 17 | 4 | 0 | 0 | 1 | 2 | 0.0 |
 Jack Drury C |
0 | 0 | 0 | 0 | -1 | 14:27 | 18 | 1 | 0 | 0 | 0 | 0 | 77.8 |
| Adam Edstrom C |
0 | 0 | 0 | 0 | -1 | 14:35 | 19 | 3 | 1 | 0 | 1 | 0 | 0.0 |
| Filip Forsberg LW |
0 | 1 | 0 | 7 | 1 | 23:09 | 22 | 1 | 2 | 1 | 4 | 0 | 0.0 |
 Nils Hoglander LW |
1 | 0 | 0 | 6 | 1 | 17:59 | 20 | 0 | 1 | 1 | 1 | 0 | 0.0 |
 Alexander Kerfoot C |
0 | 0 | 0 | 0 | 0 | 11:57 | 16 | 0 | 0 | 0 | 0 | 2 | 25.0 |
 Ryan O’Reilly C |
0 | 1 | 0 | 4 | -3 | 19:19 | 23 | 1 | 0 | 0 | 0 | 0 | 58.3 |
 Vitali Pinchuk C |
0 | 0 | 0 | 1 | 0 | 10:21 | 12 | 1 | 1 | 0 | 0 | 0 | 0.0 |
 Reid Schaefer LW |
0 | 0 | 0 | 0 | 0 | 11:13 | 12 | 2 | 1 | 0 | 0 | 0 | 0.0 |
| Steven Stamkos C |
1 | 0 | 0 | 2 | -3 | 18:47 | 19 | 2 | 0 | 0 | 1 | 0 | 84.6 |
 Shane Wright C |
0 | 0 | 0 | 2 | 1 | 18:22 | 21 | 0 | 2 | 0 | 3 | 2 | 45.5 |
Defenses
| Player | G | A | SOG | S | +/- | TOI | SHFT | HT | BS | TK | GV | PIM | FO% |
|---|---|---|---|---|---|---|---|---|---|---|---|---|---|
 Daemon Hunt D |
0 | 0 | 0 | 1 | 0 | 13:36 | 16 | 2 | 0 | 0 | 0 | 0 | 0.0 |
| Roman Josi D |
0 | 0 | 0 | 3 | -3 | 27:19 | 27 | 0 | 1 | 0 | 1 | 0 | 0.0 |
 Nick Perbix D |
0 | 0 | 0 | 0 | 0 | 15:36 | 20 | 0 | 0 | 0 | 1 | 0 | 0.0 |
 Brady Skjei D |
0 | 0 | 0 | 2 | 0 | 18:10 | 22 | 0 | 0 | 0 | 0 | 0 | 0.0 |
 Jayden Struble D |
0 | 0 | 0 | 0 | 0 | 15:50 | 16 | 4 | 2 | 0 | 0 | 0 | 0.0 |
 Adam Wilsby D |
0 | 1 | 0 | 2 | -3 | 22:00 | 25 | 0 | 0 | 0 | 0 | 0 | 0.0 |
Goalies
| Player | GA | SA | SOS | SOSA | SV | SV% | ESSV | PPSV | SHSV | TOI | YTDG | PIM |
|---|---|---|---|---|---|---|---|---|---|---|---|---|
| Juuse Saros G |
4 | 24 | 0 | 0 | 20 | .833 | 15 | 3 | 2 | 57:00 | 0 | 0 |
San Jose Sharks
Forwards
| Player | G | A | SOG | S | +/- | TOI | SHFT | HT | BS | TK | GV | PIM | FO% |
|---|---|---|---|---|---|---|---|---|---|---|---|---|---|
| Macklin Celebrini C |
1 | 2 | 0 | 5 | 3 | 19:28 | 22 | 0 | 0 | 1 | 2 | 2 | 22.2 |
 Ty Dellandrea C |
0 | 0 | 0 | 0 | 0 | 14:35 | 19 | 4 | 0 | 0 | 0 | 0 | 33.3 |
 Adam Gaudette RW |
0 | 0 | 0 | 2 | 0 | 10:56 | 14 | 1 | 1 | 0 | 0 | 0 | 80.0 |
 Barclay Goodrow C |
0 | 0 | 0 | 0 | 0 | 11:34 | 17 | 4 | 1 | 0 | 0 | 0 | 0.0 |
 Collin Graf RW |
1 | 0 | 0 | 1 | 0 | 19:01 | 22 | 1 | 0 | 0 | 0 | 0 | 0.0 |
 Mason Marchment LW |
0 | 1 | 0 | 1 | 0 | 15:15 | 17 | 1 | 1 | 0 | 1 | 0 | 0.0 |
 Michael Misa C |
0 | 1 | 0 | 2 | 0 | 15:59 | 19 | 0 | 2 | 0 | 0 | 2 | 40.0 |
 Zack Ostapchuk C |
0 | 0 | 0 | 1 | 0 | 10:58 | 17 | 0 | 0 | 0 | 0 | 0 | 75.0 |
| Kiefer Sherwood LW |
0 | 0 | 0 | 2 | 0 | 10:55 | 14 | 2 | 0 | 1 | 1 | 0 | 0.0 |
 Will Smith C |
1 | 2 | 0 | 3 | 3 | 15:29 | 20 | 1 | 0 | 1 | 3 | 0 | 0.0 |
 Ivar Stenberg LW |
1 | 1 | 0 | 1 | 3 | 19:22 | 22 | 0 | 2 | 0 | 0 | 0 | 0.0 |
| Tyler Toffoli C |
0 | 0 | 0 | 0 | 0 | 9:25 | 13 | 0 | 0 | 1 | 0 | 0 | 0.0 |
Defenses
| Player | G | A | SOG | S | +/- | TOI | SHFT | HT | BS | TK | GV | PIM | FO% |
|---|---|---|---|---|---|---|---|---|---|---|---|---|---|
 Sam Dickinson D |
0 | 0 | 0 | 0 | 1 | 22:18 | 28 | 1 | 0 | 0 | 1 | 0 | 0.0 |
 Michael Kesselring D |
0 | 0 | 0 | 0 | 1 | 18:10 | 24 | 0 | 0 | 0 | 1 | 0 | 0.0 |
 Darnell Nurse D |
0 | 0 | 0 | 2 | 2 | 23:24 | 26 | 4 | 2 | 0 | 1 | 4 | 0.0 |
 Dmitry Orlov D |
0 | 0 | 0 | 0 | 0 | 16:19 | 20 | 2 | 4 | 0 | 4 | 0 | 0.0 |
| Eric Pohlkamp D | 0 | 0 | 0 | 2 | 0 | 16:14 | 21 | 1 | 2 | 0 | 2 | 0 | 0.0 |
 Jacob Trouba D |
0 | 1 | 0 | 2 | 2 | 24:09 | 28 | 1 | 1 | 1 | 0 | 0 | 0.0 |
Goalies
| Player | GA | SA | SOS | SOSA | SV | SV% | ESSV | PPSV | SHSV | TOI | YTDG | PIM |
|---|---|---|---|---|---|---|---|---|---|---|---|---|
| Alex Nedeljkovic G |
2 | 34 | 0 | 0 | 32 | .941 | 29 | 3 | 0 | 60:00 | 0 | 0 |
Attendance 14,949 · Officials: Eric Furlatt, Bevan Mills, Corey Syvret, Joe Mahon
Recap: Sharks beat Predators 4-2 to end Nashville’s 7-game win streak (ESPN)
Highlights
Betting trends
- Predators have covered the spread in 8 straight games.
- The under has hit in 6 straight Predators games.
- Predators are 9-1 against the spread in their last 10.
- Predators are 9-0 ATS as underdogs in their last 10 games.
- Sharks have covered the spread in 4 straight games.
- The over is 3-7 in Sharks’ last 10 games.
- Predators are 8-2 in the last 10 meetings with the Sharks.
From each team’s last 10 games and recent meetings, against the closing line.
 Polymarket
Affiliate link: StatsBench may earn a commission if you sign up. 18+ (21+ where required); availability depends on where you live.
Predators vs Sharks pre-game preview
Nashville visits San Jose on Sunday at 9:00 PM ET. The market lists Nashville -163 and San Jose +143 on the moneyline, San Jose +1.5 on the spread, and a 6.5 total, with the spread and total unchanged from the DraftKings opener.
The last meeting was October 15, 2026, when Nashville lost 2-3 at home. Nashville is 8-2 straight up and 9-1 against the spread over its last 10, and San Jose is 2-8 straight up and 3-7 against the spread over its last 10. In the last 10 head-to-head meetings, Nashville is 8-2 straight up and 5-2 against the spread.
The defensive ranks show Nashville allowing 2.6 goals per game (fourth) and 0.9 power-play points allowed (first), while San Jose allows 3.43 goals (23rd) and 2.57 power-play points (24th). San Jose plays at the fastest listed pace (58.6, first). Among props, Roman Josi over 1.5 shots on goal at -270 has cleared in 9 of his last 10, and the StatsBench model projects Filip Forsberg at 1 point for his over 0.5 at -290.
Player stats and form
Season averages and each player’s last 5 games, newest first. Splits: per-game averages (games in brackets); vs the opponent covers this season and last, newest game first.
Nashville Predators
| Date | Opp | TOI | G | A | SOG | HIT |
|---|---|---|---|---|---|---|
| 11/13 | @ VGK | 31:40 | 0 | 1 | 3 | 0 |
| 11/11 | @ ANA | 26:03 | 0 | 2 | 1 | 1 |
| 11/10 | @ LAK | 23:56 | 0 | 0 | 3 | 0 |
| 11/7 | vs STL | 25:38 | 0 | 2 | 2 | 1 |
| 11/5 | @ COL | 28:02 | 0 | 1 | 2 | 2 |
| Splits | Season | Road | 2025-26 | vs SJ |
|---|---|---|---|---|
| PTS | 1.2 (20) | 0.9 (9) | 0.8 (68) | 1.3 (4) 1 · 1 · 2 · 1 |
| SOG | 2.7 (20) | 2.0 (9) | 2.7 (68) | 4.3 (4) 8 · 2 · 4 · 3 |
| Date | Opp | TOI | G | A | SOG | HIT |
|---|---|---|---|---|---|---|
| 11/13 | @ VGK | 22:33 | 0 | 0 | 1 | 2 |
| 11/11 | @ ANA | 18:20 | 0 | 0 | 2 | 1 |
| 11/10 | @ LAK | 20:12 | 2 | 0 | 3 | 0 |
| 11/7 | vs STL | 20:48 | 0 | 1 | 3 | 1 |
| 11/5 | @ COL | 20:07 | 0 | 0 | 3 | 3 |
| Splits | Season | Road | 2025-26 | vs SJ |
|---|---|---|---|---|
| PTS | 1.1 (20) | 0.6 (9) | 0.9 (82) | 1.8 (4) 1 · 0 · 3 · 3 |
| SOG | 2.5 (20) | 1.8 (9) | 3.0 (82) | 3.0 (4) 6 · 2 · 2 · 2 |
| Date | Opp | TOI | G | A | SOG | HIT |
|---|---|---|---|---|---|---|
| 11/13 | @ VGK | 20:33 | 0 | 1 | 2 | 0 |
| 11/11 | @ ANA | 16:05 | 1 | 0 | 1 | 0 |
| 11/10 | @ LAK | 18:21 | 0 | 0 | 2 | 0 |
| 11/7 | vs STL | 19:23 | 1 | 1 | 5 | 0 |
| 11/5 | @ COL | 19:01 | 1 | 0 | 3 | 2 |
| Splits | Season | Road | 2025-26 | vs SJ |
|---|---|---|---|---|
| PTS | 1.1 (20) | 1.0 (9) | 0.8 (82) | 0.8 (4) 1 · 0 · 1 · 1 |
| SOG | 2.5 (20) | 2.0 (9) | 2.5 (82) | 3.5 (4) 2 · 8 · 2 · 2 |
San Jose Sharks
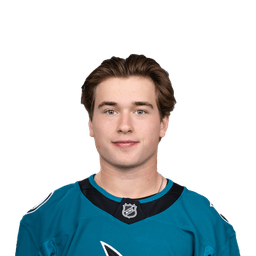
| Date | Opp | TOI | G | A | SOG | HIT |
|---|---|---|---|---|---|---|
| 11/14 | @ UTA | 21:57 | 0 | 1 | 4 | 2 |
| 11/11 | vs PIT | 25:14 | 1 | 1 | 2 | 1 |
| 11/9 | vs NYI | 25:40 | 0 | 0 | 6 | 0 |
| 11/7 | @ DAL | 28:05 | 0 | 3 | 6 | 0 |
| 11/6 | @ MIN | 24:59 | 1 | 0 | 6 | 0 |
| Splits | Season | Home | 2025-26 | vs NSH |
|---|---|---|---|---|
| PTS | 1.2 (20) | 1.1 (10) | 1.4 (82) | 0.8 (4) 0 · 2 · 1 · 0 |
| SOG | 4.2 (20) | 3.8 (10) | 3.5 (82) | 3.3 (4) 3 · 2 · 5 · 3 |
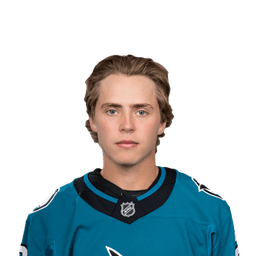
| Date | Opp | TOI | G | A | SOG | HIT |
|---|---|---|---|---|---|---|
| 11/14 | @ UTA | 20:51 | 0 | 1 | 0 | 0 |
| 11/11 | vs PIT | 22:18 | 0 | 1 | 3 | 1 |
| 11/9 | vs NYI | 23:54 | 0 | 0 | 3 | 0 |
| 11/7 | @ DAL | 23:44 | 1 | 1 | 3 | 0 |
| 11/6 | @ MIN | 21:11 | 0 | 1 | 2 | 1 |
| Splits | Season | Home | 2025-26 | vs NSH |
|---|---|---|---|---|
| PTS | 0.7 (22) | 0.7 (10) | 0.9 (69) | 1.0 (4) 1 · 1 · 0 · 2 |
| SOG | 2.5 (22) | 2.6 (10) | 2.4 (69) | 4.0 (4) 5 · 2 · 3 · 6 |
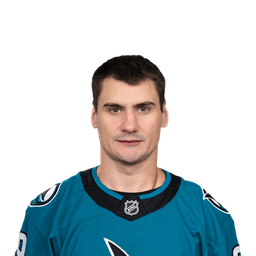
| Date | Opp | TOI | G | A | SOG | HIT |
|---|---|---|---|---|---|---|
| 11/14 | @ UTA | 18:51 | 1 | 3 | 2 | 1 |
| 11/11 | vs PIT | 15:42 | 0 | 0 | 1 | 4 |
| 11/9 | vs NYI | 15:16 | 0 | 1 | 2 | 3 |
| 11/7 | @ DAL | 12:42 | 0 | 0 | 1 | 0 |
| 11/6 | @ MIN | 15:02 | 0 | 1 | 0 | 1 |
| Splits | Season | Home | 2025-26 | vs NSH |
|---|---|---|---|---|
| PTS | 0.6 (22) | 0.4 (10) | 0.5 (82) | 0.3 (4) 0 · 0 · 1 · 0 |
| SOG | 1.0 (22) | 1.0 (10) | 1.1 (82) | 2.3 (4) 2 · 2 · 3 · 2 |
Records
| Team | Record | ATS | O/U | Home | Away |
|---|---|---|---|---|---|
| Predators |
11-9 | 15-5 | 8-12 | 6-5 | 5-4 |
| Sharks |
9-13 | 10-12 | 10-12 | 4-6 | 5-7 |
This season, regular season. ATS and O/U against each game’s closing line.
Predators vs Sharks head-to-head
Predators are 8-2, 5-2 ATS, O/U 5-2 in the last 10 meetings. Last time: Predators lost 2-3 on October 15, 2026.
| Date | Venue | Predators result | ATS | O/U |
|---|---|---|---|---|
| Oct 15, 26 | Predators home | L 2-3 | L -1.5 | U 6.5 |
| Apr 13, 26 | Predators home | L 2-3 | L -1.5 | U 6.5 |
| Apr 4, 26 | Sharks home | W 6-3 | W +1.5 | O 6.5 |
| Mar 24, 26 | Predators home | W 6-3 | W -1.5 | O 6.5 |
| Mar 11, 25 | Sharks home | W 3-2 | – | – |
| Jan 23, 25 | Sharks home | W 6-5 | – | – |
| Jan 21, 25 | Predators home | W 7-5 | – | – |
| Mar 19, 24 | Predators home | W 8-2 | W -1.5 | O 5.5 |
| Feb 24, 24 | Sharks home | W 4-2 | W -1.5 | O 5.5 |
| Oct 21, 23 | Predators home | W 5-1 | W -1.5 | O 5.5 |
Recent form
Nashville Predators: last 10 (8-2, 9-1 ATS, O/U 4-6)
| Date | Opponent | Result | ATS | O/U |
|---|---|---|---|---|
| Nov 13, 26 | @ VGK | W 3-2 | W +1.5 | U 6.5 |
| Nov 11, 26 | @ ANA | W 4-2 | W +1.5 | U 6.5 |
| Nov 10, 26 | @ LA | W 3-0 | W +1.5 | U 6.5 |
| Nov 7, 26 | vs STL | W 3-1 | W +1.5 | U 5.5 |
| Nov 5, 26 | @ COL | W 3-2 | W +1.5 | U 6.5 |
| Nov 3, 26 | vs CAR | W 4-1 | W +1.5 | U 6.5 |
| Oct 31, 26 | vs TB | W 5-4 | W +1.5 | O 6.5 |
| Oct 29, 26 | vs WSH | L 3-4 | W +1.5 | O 6.5 |
| Oct 27, 26 | vs NYI | L 3-4 | L -1.5 | O 5.5 |
| Oct 25, 26 | vs COL | W 6-2 | W +1.5 | O 6.5 |
San Jose Sharks: last 10 (3-7, 4-6 ATS, O/U 3-7)
| Date | Opponent | Result | ATS | O/U |
|---|---|---|---|---|
| Nov 14, 26 | @ UTA | W 6-5 | W +1.5 | O 6.5 |
| Nov 11, 26 | vs PIT | L 2-3 | W +1.5 | U 6.5 |
| Nov 9, 26 | vs NYI | W 3-2 | W +1.5 | U 6.5 |
| Nov 7, 26 | @ DAL | L 3-4 | W +1.5 | O 6.5 |
| Nov 6, 26 | @ MIN | L 1-4 | L +1.5 | U 6.5 |
| Nov 4, 26 | @ LA | L 2-7 | L +1.5 | O 6.5 |
| Nov 2, 26 | vs CGY | L 1-2 | L -1.5 | U 6.5 |
| Oct 31, 26 | vs OTT | L 1-5 | L +1.5 | U 6.5 |
| Oct 29, 26 | vs VAN | W 3-2 | L -1.5 | U 6.5 |
| Oct 27, 26 | vs BUF | L 0-2 | L +1.5 | U 6.5 |
Injury report
Nashville Predators
- Jonathan Marchessault (C): Out, Lower Body
San Jose Sharks
- Alexander Wennberg (C): Out, Upper Body
- Igor Chernyshov (L): Injured Reserve, Head coach Ryan Warsofsky said Sunday that Chernyshov
Matchup ranks
What each defense allows per game this season. Rank 1 allows the fewest, so a high number means a softer matchup for the other team’s overs.
| Predators defense | Sharks defense | |
|---|---|---|
| Goals allowed per game | 2.67 (6th of 32) | 3.43 (22nd of 32) |
| Shots on goal allowed per game | 29.38 (27th of 32) | 30.7 (31st of 32) |
| Points allowed per game | 7.43 (9th of 32) | 9.17 (20th of 32) |
| Power-play points allowed per game | 0.86 (1st of 32) | 2.74 (26th of 32) |
| Pace (possessions) | 56 (7th) | 58.3 (2nd) |
Venue and weather
Predators vs Sharks odds
Line movement from the open
| Line | Open | Close | Move |
|---|---|---|---|
| Sharks spread | +1.5 | +1.5 | – |
| Total | 6.5 | 6.5 | – |
| Predators moneyline | -170 | -170 | – |
| Sharks moneyline | +142 | +142 | – |
DraftKings opening and closing numbers via ESPN.
Line movement chart
More on these teams: Nashville Predators stats · San Jose Sharks stats · San Jose Sharks vs Utah Mammoth Nov 14 · Nashville Predators vs Vegas Golden Knights Nov 13 · All NHL prop picks
Betting guides: NHL player props guide · NHL shots on goal strategy · NHL points props guide · how parlays work
21+. Research, not a guarantee: every bet can lose. Bet within your means; if gambling stops being fun, call 1-800-GAMBLER.
 Today's NBA picks
 Today's NFL picks
 Today's NHL picks
 Today's College Football picks

 Today's College Basketball picks
 Today's CS2 picks


 Today's Valorant picks
 Today's Dota 2 picks


 BOS
 PHI
 DET
 ATL
 MIA
 NY
 CLE
 ORL
 TOR
 IND
 CHA
 WSH
 BKN
 CHI
 MIL
 SA
 LAL
 HOU
 POR
 MIN
 MEM
 OKC
 DEN
 GS
 DAL
 PHX
 LAC
 NO
 SAC
 UTAH
 BUF
 KC
 JAX
 CIN
 DEN
 PIT
 CLE
 NE
 BAL
 LV
 HOU
 IND
 NYJ
 MIA
 TEN
 LAC
 SF
 DET
 NYG
 CAR
 MIN
 CHI
 GB
 SEA
 LAR
 DAL
 WSH
 TB
 NO
 ATL
 ARI
 PHI
 CAR
 NJ
 TB
 MTL
 OTT
 BOS
 FLA
 NYR
 NYI
 WSH
 BUF
 DET
 TOR
 PHI
 PIT
 CBJ
 EDM
 MIN
 VGK
 COL
 DAL
 ANA
 UTA
 WPG
 STL
 SEA
 CGY
 LA
 CHI
 VAN
 UGA
 UTAH
 ND
 UCLA
 IU
 MIA
 ALA
 TEX
 TENN
 WAKE
 TTU
 BYU
 IOWA
 ORE
 BOIS
 MISS
 OSU
 UK
 USC
 ARIZ
 HOU
 LOU
 LSU
 DUKE
 FLA
 ILL
 CONN
 MSU
 UVA
 SJU
 GONZ
 KU
 ARK
 MICH
 VAN
 NEB
 Premier League table
 ARS
 BHA
 MCI
 LIV
 CHE
 EVE
 BOU
 BRE
 LEE
 AVL
 TOT
 NEW
 Hull City
 IPS
 FUL
 NFO
 Coventry
 MUN
 SUN
 CRY
 La Liga table
 BAR
 RMA
 ATM
 BET
 RSO
 SEV
 ATH
 VIL
 DEP
 RAC
 CEL
 ALA
 ESY
 RAY
 GET
 OSA
 LVT
 ELC
 VAL
 MAL
 Serie A table
 LAZ
 INT
 ROM
 MIL
 COM
 Frosinone
 JUV
 BOL
 CAG
 NAP
 TOR
 ATA
 GEN
 LEC
 FIO
 PRM
 SAS
 MON
 VEN
 UDI
 Bundesliga table
 FCB
 BVB
 SCF
 RBL
 B04
 SVW
 SV Elversberg
 VFB
 TSG
 SGE
 HSV
 M05
 SC Paderborn 07
 FCA
 KOE
 FCU
 FC Schalke 04
 BMG
 Ligue 1 table
 PSG
 LOSC
 PFC
 OM
 LYO
 NCE
 ASM
 REN
 B29
 LOR
 LEN
 TOU
 STR
 AUX
 Le Mans
 ANG
 Troyes
 LEH