
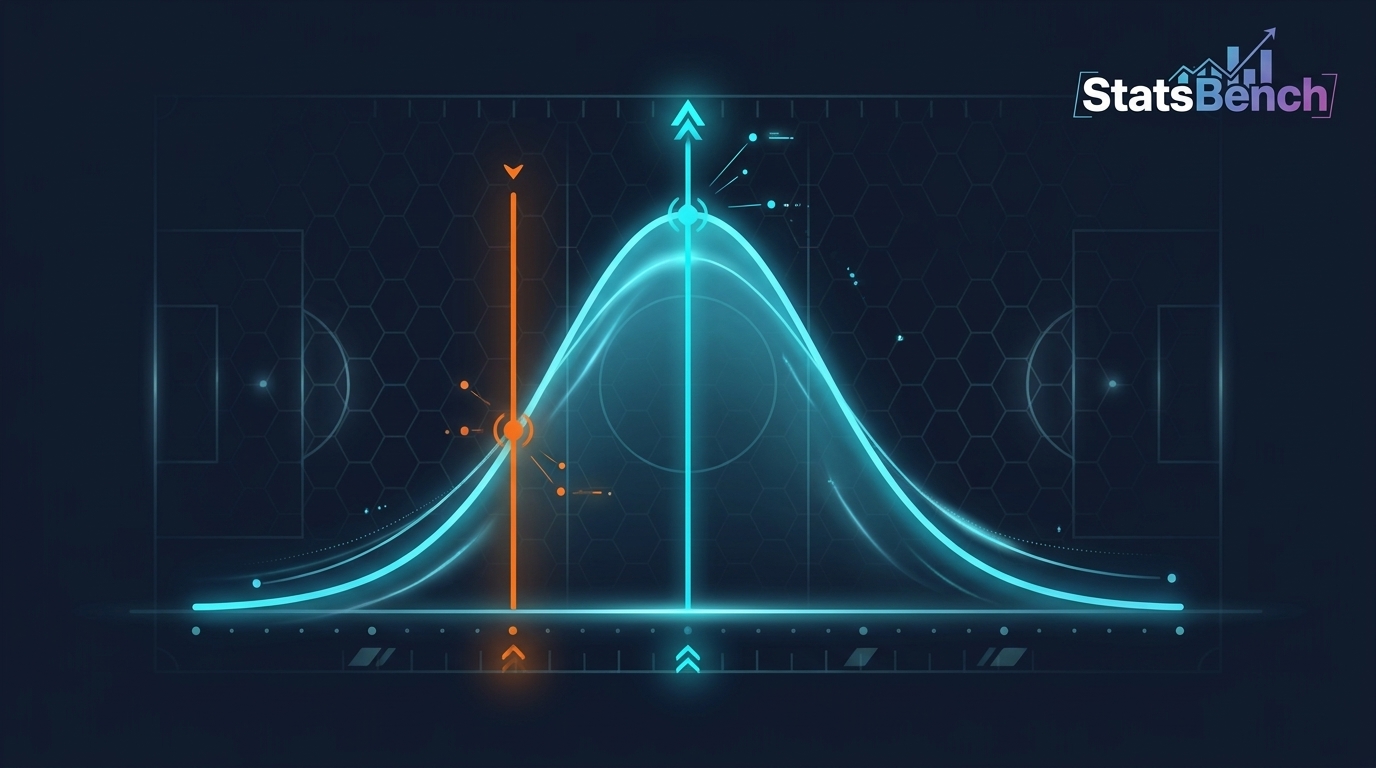
A mean prediction is the average outcome you expect from a player if the same situation played out over and over. In prop betting, it’s the number you hold up against the line. When your predicted mean sits clearly above the posted number, you have a reason to bet. When it sits below, you don’t.
The concept is simple. The execution isn’t. A mean on its own says nothing about price, spread, or sample size, and those three decide whether a good number turns into a good bet.
What Is a Mean Prediction?
A mean prediction is the expected average of every possible outcome in a distribution, not a forecast of one specific result. Roll a fair die 600 times and the mean prediction is 3.5. You will never actually roll a 3.5. That’s the expected value of the roll, and it’s useful even though no single result matches it. The spread around that number matters just as much.
Player props work the same way. If a running back’s typical workload produces about 18 rushing yards against this kind of defense, 18 is the mean. The book posts 14.5. Now you have something to argue about.
Here’s the part most bettors skip. StatsBench doesn’t hand you a projected mean. It shows the evidence behind one: hit rates, consistency grades, the best available price across roughly 60 sportsbooks, and a filter for how each defense plays a position. You bring the estimate.
The Mean Is Not the Line
Books set lines where they expect money on both sides. That number isn’t always the true mean, and it doesn’t have to be. It’s the price that balances action. Your job is to notice when their number and the underlying reality drift apart.
A Real Example From a September 2026 NFL Slate
Abstract talk is cheap, so here’s a snapshot. These are real StatsBench prop rows from a Chargers vs. Bills matchup, pulled in September 2026. Every one of them cleared its line in 60% of the last 10 games.
| Player | Market | Line | Hit rate | Edge | Best price |
|---|---|---|---|---|---|
| Keaton Mitchell | Rushing yards | 14.5 | 60% (6/10) | 13.6% | -110 |
| Justin Herbert | Rushing yards | 20.5 | 60% (6/10) | 7.6% | -110 |
| Justin Herbert | Rushing attempts | 4.5 | 60% (6/10) | 1.0% | -105 |
| James Cook III | Rushing attempts | 17.5 | 60% (6/10) | 0.8% | -106 |
| Oronde Gadsden | Longest reception | 15.5 | 60% (6/10) | 2.9% | -107 |
| James Cook III | Receptions | 1.5 | 60% (6/10) | 0.2% | -150 |
Six props, six identical hit rates. If hit rate were the whole story, all six would be equally attractive. They aren’t.
The edge column runs from 13.6% down to 0.2%. Keaton Mitchell’s rushing yards number sat well clear of its price. James Cook’s receptions prop at -150 barely cleared break-even, even though the hit rate looked the same. Identical percentages, very different bets.
Edge here measures how far the best available price sits from a fairer one. It is not a promise. Edges of this size are how bettors grind out results over hundreds of bets. In any single week, they mean close to nothing. Hit rate and edge answer different questions, and you need both before you commit money.
How Do You Turn a Predicted Mean Into a Bet?
Start with the price. At -110, the implied probability is roughly 52.4%. That’s your break-even rate. If your estimate says the player clears the line more often than that, the bet has a mathematical case.
Run it yourself with the free implied probability calculator. Then ask one question: does my number beat the break-even rate often enough to survive the juice?
Two habits separate careful bettors from the rest:
- Compare your mean to the line, then compare the line to the price. A great number at a bad price is still a bad bet.
- Think in ranges. If your projection is 19 yards but outcomes swing from 5 to 35, a 14.5 line will still lose plenty of weeks. That spread is variance, and it doesn’t care how good your research was.
StatsBench leans on hit rates, consistency grades, and best prices rather than a single projected number, which nudges you toward range thinking instead of point thinking.
Mean vs. Median: When the Average Lies
The mean is the right center for stats that cluster tightly. It’s the wrong one for lopsided counting stats.
Take a made-up pitcher who strikes out 10 batters in two starts and 2 batters in four others. His mean is 4.7. His median is 2. A strikeout line of 3.5 would look like a coin flip against the mean and a clear over candidate against the median. For spiky stats, check both.
- Tight outcomes (total bases for a contact hitter, receptions for a possession receiver): the mean usually describes the player well.
- Spiky outcomes (strikeouts, home runs, blocked shots): the median and the hit rate tell a more honest story.
Why One Number Isn’t Enough
A mean describes the center of a distribution. It says nothing about how wide that distribution is, and width is what makes props lose.
Two receivers can both average 15 yards. One lands between 12 and 18 every week. The other posts 40, 8, 4, 22, 6, and 10. Against the same 14.5 line, those are completely different bets, and their hit rates will diverge fast. That’s why a prediction interval beats a point estimate when you decide how much to trust a number.
Where Averages Go Wrong
Four failure modes show up again and again.
- Small samples dressed up as trends. Ten games is a starting point, not proof. A 60% hit rate over 10 games and 60% over 200 games are different claims, and sample size decides how much a hit rate is worth.
- Stale roles. A new play caller, a returning starter, or a jump from 40% to 70% of snaps can wipe out a season-long average overnight.
- No matchup adjustment. A mean built against average defenses says little about a top-five run defense. Defensive rankings against each position are the fastest way to check.
- Price blindness. A 60% hit rate at -150 is roughly break-even. The same 60% at +115 is a much better bet. Same player, same line, different wager.
Same hit rate, different bet is the sentence to remember when a prop looks too obvious to question.
Quarterback rushing props are a good place to watch roles and prices collide, since scrambles and designed runs behave nothing alike even when the box score treats them the same.
Build Your Own Workflow in Five Steps
- Pull the prop and the best available price from the NFL props board. Line shopping is free value, and most bettors skip it.
- Check the hit rate, the sample behind it, and the consistency grade.
- Adjust for role, matchup, and game script. A team trailing by two scores abandons the run, and your projection should know that. Recent rushing averages are easy to verify on the official NFL stats pages.
- Convert the price to implied probability. The break-even rate is your bar, not your gut.
- Size the bet like it can lose. Fractional Kelly staking keeps one bad week from erasing a good month, and the Kelly calculator handles the arithmetic.
None of this requires a model you built yourself. It requires numbers you can check and the habit of comparing them to the price. StatsBench puts both in one table, and a free account adds the Sharps feed and Bet Tracker if you want to log how your estimates hold up over time.
Bet within your means, treat this as research rather than income, and remember that 21+ and long-run variance are part of the deal. If betting stops being fun, help is available at 1-800-GAMBLER.
Live board
See today’s NFL player props on StatsBench
Live lines, last-10 hit rates and the best price across about 60 books.
Open the NFL player props board →
Prefer email? Get the daily picks newsletter.
Frequently Asked Questions
What is a mean prediction in sports betting?
It’s the average outcome you expect from a player in a given spot, not a forecast of one game. Bettors compare that number to the posted line to judge whether a prop is worth the price.
Is a mean prediction the same as the line?
No. Books set lines where they expect balanced action, which relates to the true mean but isn’t identical to it. The gap between your estimate and their number is where value shows up.
Can I profit using only a mean prediction?
Not on its own. You also need the price, the sample size, and an honest sense of how wide the outcomes spread. A great number at a bad price still loses money over time.
Should I use the mean or the median for player props?
Use the mean for stats that stay in a tight range, like receptions for a possession receiver. Switch to the median for spiky stats such as strikeouts or home runs, where a couple of big games drag the average upward.
Does StatsBench publish projected means?
No. StatsBench shows hit rates, consistency grades, matchup data, and the best available price across roughly 60 sportsbooks. You form the estimate and the tool gives you the evidence to check it.