
Today’s MLB strikeout props page refreshes every day, and this edition covers Wednesday, October 7, 2026. Five starters on tonight’s slate show over rates that stand apart from their consensus lines, and every number below comes from today’s StatsBench snapshot.
One thing to get straight first. The over rates here are recent-form hit rates against today’s consensus line. They’re a small-sample signal, not a projection and not an EV claim. Pair each one with the matchup context in the pick, then decide whether the price is worth it.
Today’s MLB strikeout props
Tyler Glasnow over 6.5 strikeouts vs Atlanta
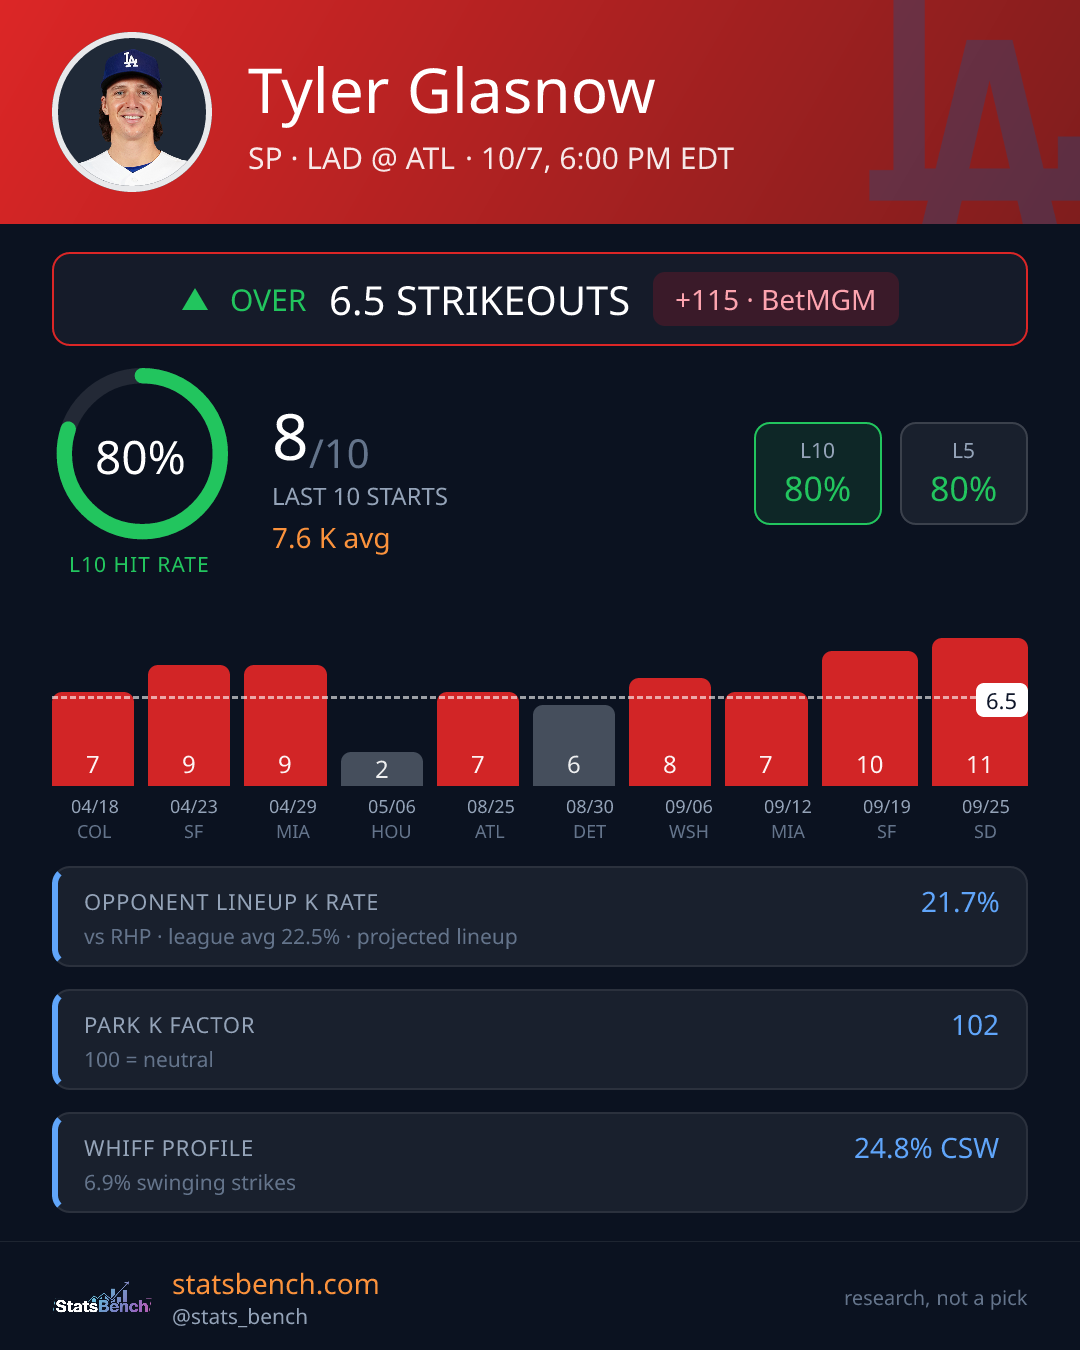
Glasnow has cleared 6.5 strikeouts in 8 of his last 10 starts (80%) while averaging 7.6, and a 34.0% season K rate with a 24.8% CSW supports the recent run. The consensus line sits at 6.5 and the best posted over is +115 at BetMGM, a plus-money price for a starter with that profile. Atlanta’s projected lineup strikes out at 21.7% against righties, just under the 22.5% league average, and his 12 days of rest is the wild card in this one. Alt lines above 6.5 exist at most books, so comparing prices before you commit is the whole game.
Tyler Mahle over 3.5 strikeouts vs Los Angeles Dodgers
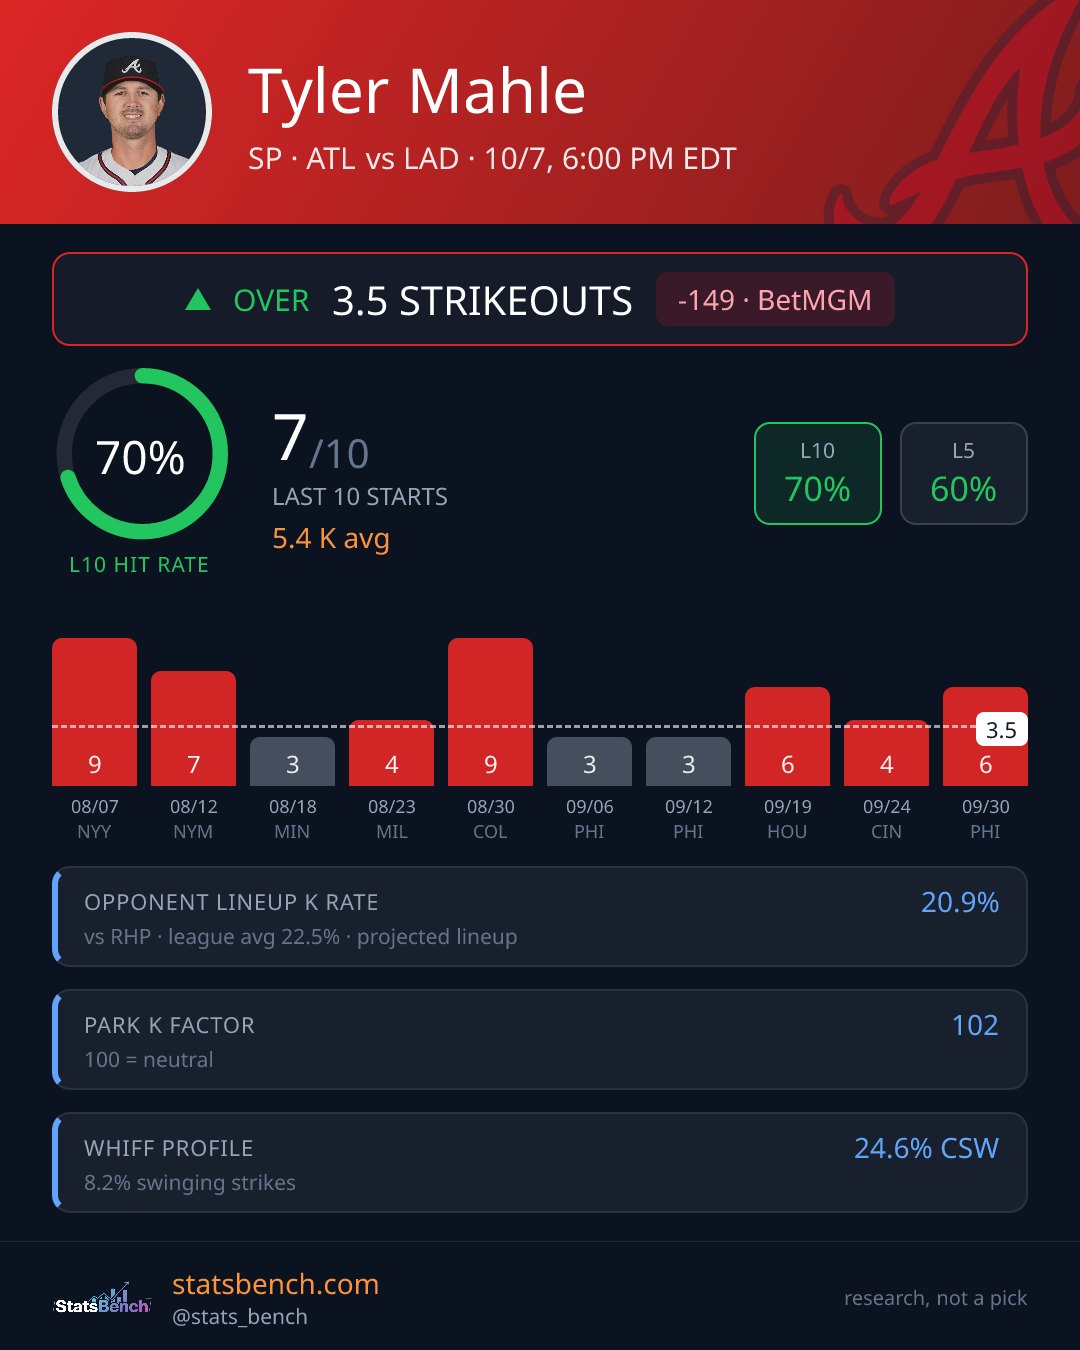
Mahle cleared 3.5 strikeouts in 7 of his last 10 starts (70%) and averages 5.4, so his recent baseline sits comfortably above this number. His 22.3% season K rate and 24.6% CSW are middle-of-the-road markers, which fits a line set this low. The Dodgers’ projected lineup checks in at 20.9% strikeouts against righties, below the 22.5% league average, and the park K factor of 102 is barely above neutral. Over 3.5 is -149 at BetMGM, and he’s on 7 days of rest, a normal turnaround with no workload question attached.
Walker Buehler over 2.5 strikeouts vs Milwaukee
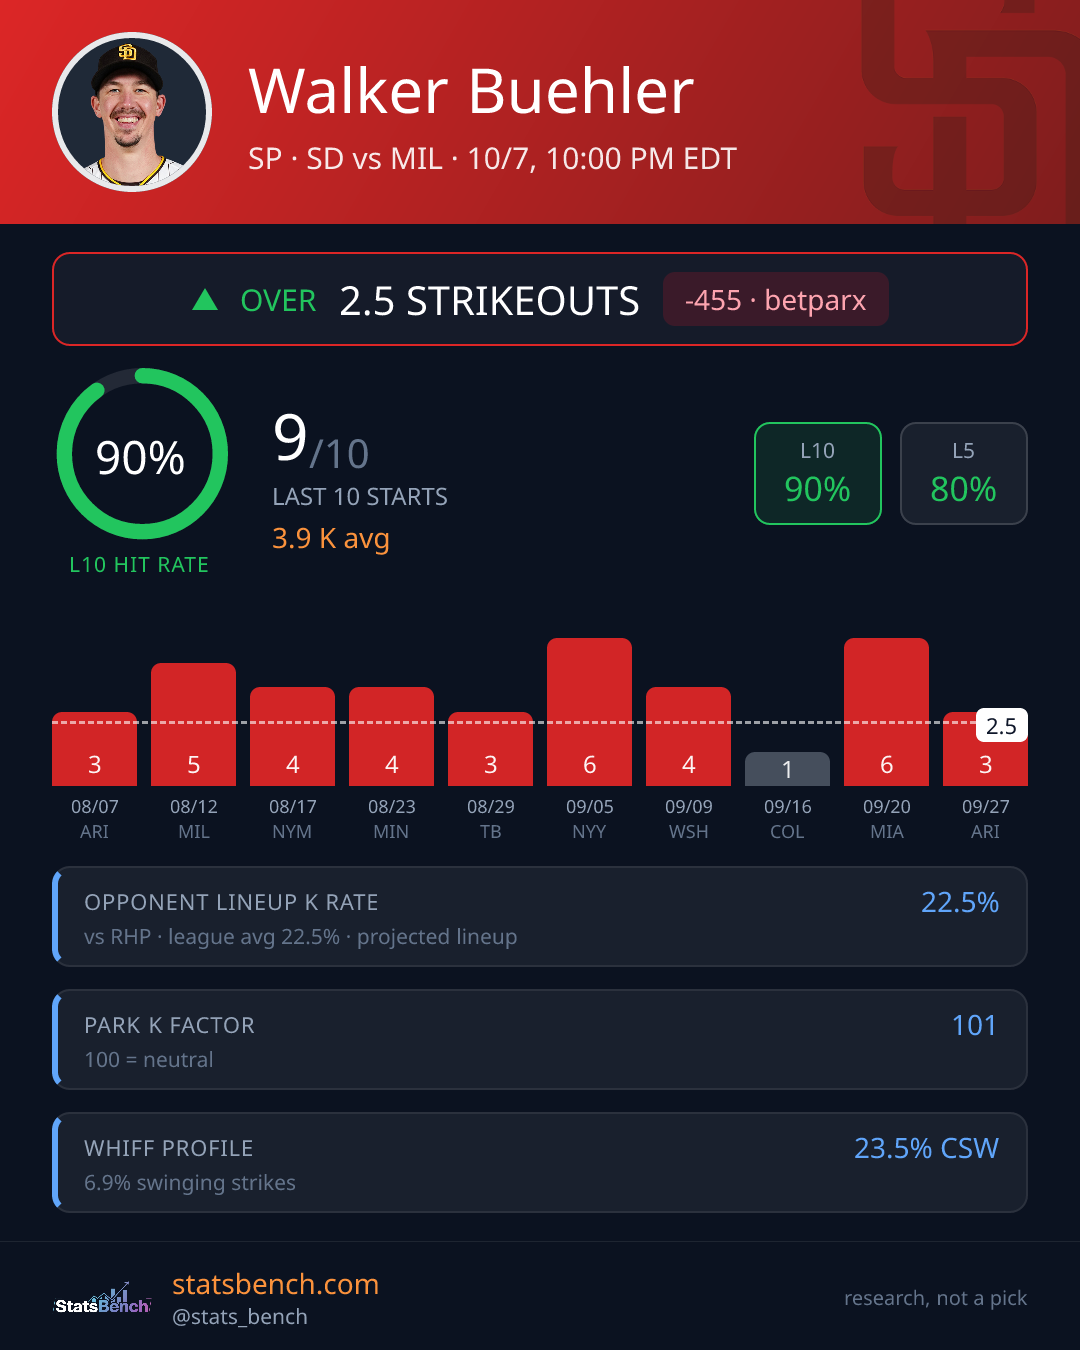
Buehler went over 2.5 strikeouts in 9 of his last 10 starts (90%), and his 3.9 average means he usually clears the bar without much drama. The underlying numbers are more modest: a 20.1% season K rate with a 23.5% CSW. Milwaukee’s projected lineup posts a 22.5% K rate against righties, identical to the 22.5% league average, and the park K factor of 101 is essentially neutral. That low bar is why the best posted over is -455 at BetParx. If you want a better price, an alternate line at 3.5 is the lever.
Nick Martinez over 2.5 strikeouts vs New York Yankees
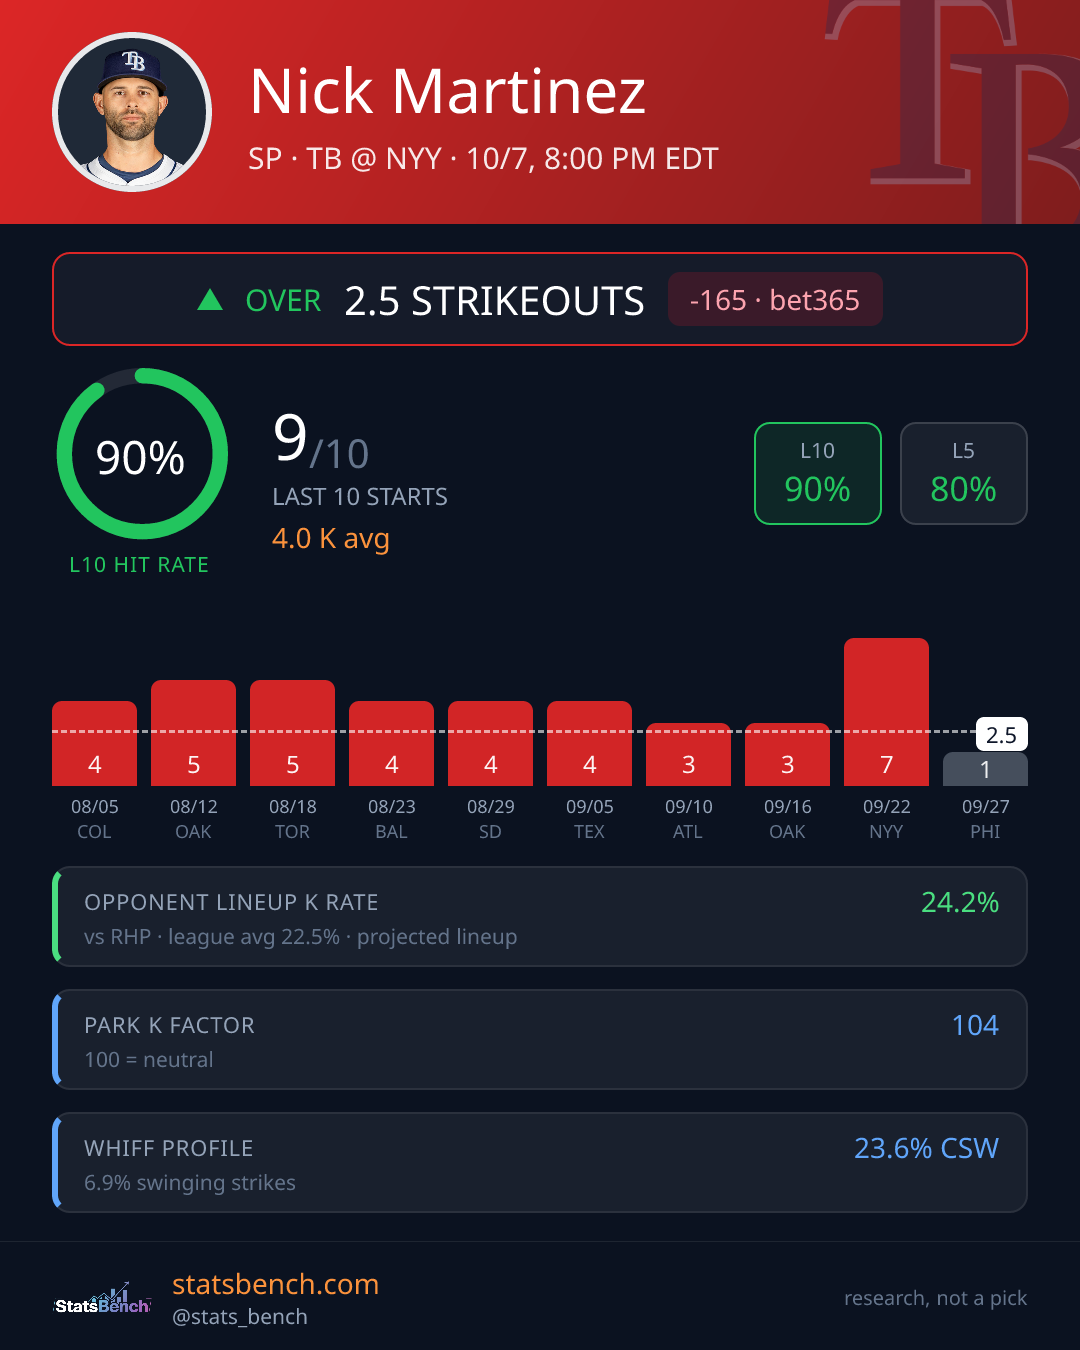
Martinez cleared 2.5 strikeouts in 9 of his last 10 starts (90%) with a 4.0 average, matching the best recent hit rate on this page. The Yankees’ projected lineup carries a 24.2% K rate against righties, above the 22.5% league average, and the park K factor of 104 is the highest of any pick listed here. The catch is a 15.2% season K rate, the lowest in this group, so the over rate is carrying more weight than the underlying skill. Over 2.5 is -165 at bet365 and he’s on 10 days of rest.
Sean Newcomb over 0.5 strikeouts vs Cleveland
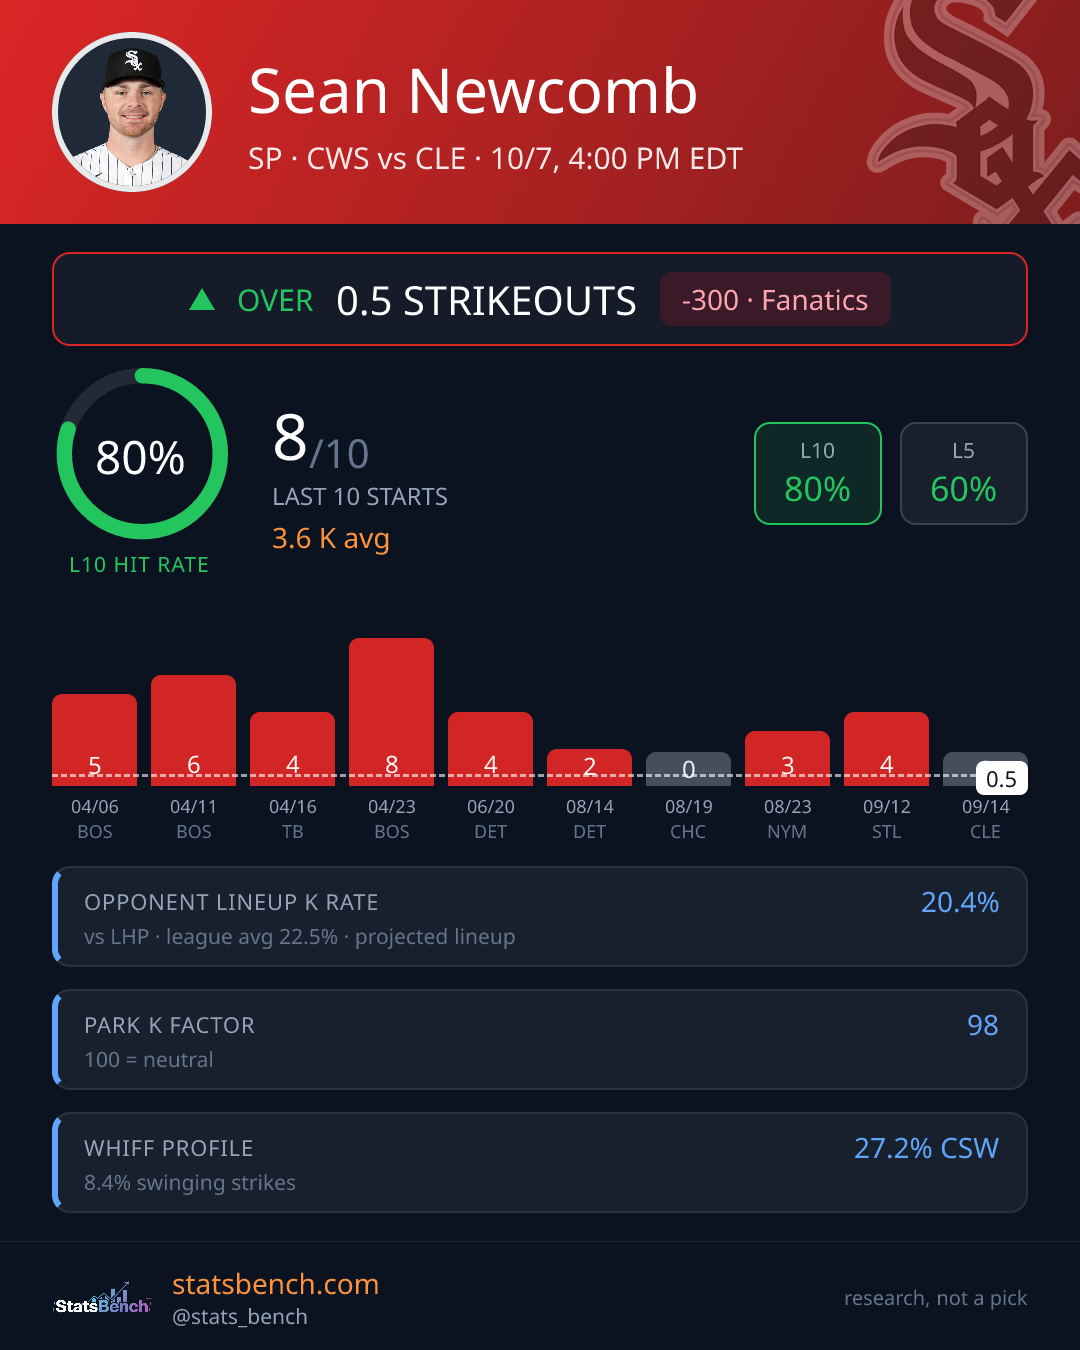
Newcomb went over 0.5 strikeouts in 8 of his last 10 starts (80%), the lowest bar on the board for a pitcher with a 34.2% season K rate and a 27.2% CSW. The price reflects how easy that bar looks: -300 at Fanatics for a single strikeout. Cleveland’s projected lineup strikes out at 20.4% against lefties, below the 22.5% league average, and the park K factor of 98 is a slight drag on top of that. He’s also on 23 days of rest, so there’s no recent workload read to lean on, and at that juice the fair question is whether the bet is worth making at all.
How these strikeout props get built
Every number on this page comes from the StatsBench MLB Strikeout tool, a stats aggregator rather than a projection model. It pulls together:
- Pitch-mix and whiff rates
- Opponent K vulnerability by pitch type and handedness
- L5/L15/L30 strikeout form
- Live K lines across books
Lines shown are the consensus across sportsbooks, and the price listed is the best posted over at the time of the snapshot. Alt lines vary by book, so the same pitcher can look very different depending on where you shop. The over rates are a recent-form signal from a small sample. Treat them as one input, not a verdict, and remember that a high hit rate does not shrink the variance in a single start.
Responsible gambling
This is research, not a promise. Strikeout props swing hard from start to start, and a 9 of 10 recent over rate doesn’t mean the next outing follows the script. Bet within your means, treat it as entertainment, and remember that 21+ (or the legal age where you are) is the floor, not a suggestion. If betting stops being fun, call 1-800-GAMBLER. Legality and availability vary by region, so check your local rules before you place anything.
Frequently Asked Questions
What do the over rates on this page actually measure?
They’re recent-form hit rates against today’s consensus strikeout line, so 9 of 10 means the pitcher cleared that number in nine of his last ten starts. That’s a small-sample signal, not a projection. Use it alongside the matchup context, not instead of it.
What’s the difference between the consensus line and the posted price?
The line is the strikeout total agreed on across sportsbooks, while the price is the best posted over at the time of the snapshot. Shopping matters because the same line can be priced differently book to book, and alternate lines move both the bar and the payout at the same time.
Does the StatsBench MLB strikeout tool project strikeouts?
No. It’s a stats aggregator, not a projection model. It brings together pitch-mix and whiff data, opponent K vulnerability by pitch and handedness, recent form and live K lines so you can do the research yourself.
How often is this page updated?
Daily. The same URL is refreshed with current lines and picks instead of publishing a new post, so the numbers here always reflect the most recent snapshot.
Should I bet every pitcher listed?
No. Each pick is one input among several, and strikeout props carry real start-to-start variance. Take the spots where the price and the context line up, size within your bankroll, and skip the rest.