
Most NFL QB props are priced tight. Passing yards on a starting quarterback gets bet from every angle, so you rarely find a soft number. The edges usually sit in the props nobody argues about: attempts, completions, and combo lines.
StatsBench’s Sept 24, 2026 board showed that split on one screen. Five props on the same quarterback carried the same 60% hit rate, and the flagged edges still ranged from +8.1% to -1.3%. Same player. Same game. Very different prices.
Here’s how to read that spread, what it does and doesn’t tell you, and how to check a price before you bet it.
NFL QB props come in two flavors
Quarterback props split into headline markets and secondary markets. They don’t behave the same way, so they shouldn’t be read the same way.
- Headline markets: passing yards, passing touchdowns, interceptions. Heavily bet, usually efficiently priced.
- Secondary markets: passing attempts, completions, longest rush, and combined lines like passing + rushing yards. Thinner action, so prices drift more.
More money in a market tends to mean a sharper number. When a prop draws fewer bets, the book leans on its own model and the line doesn’t get corrected as fast.
That’s a tendency, not a law. Plenty of secondary lines are priced correctly, and headline lines go soft the moment news breaks. Treat the split as a place to look first, never as a conclusion. StatsBench lists about 14 NFL prop types, so a single quarterback can appear on five or six boards at once. That’s a lot of prices to compare in one afternoon.
One quarterback’s five props, side by side
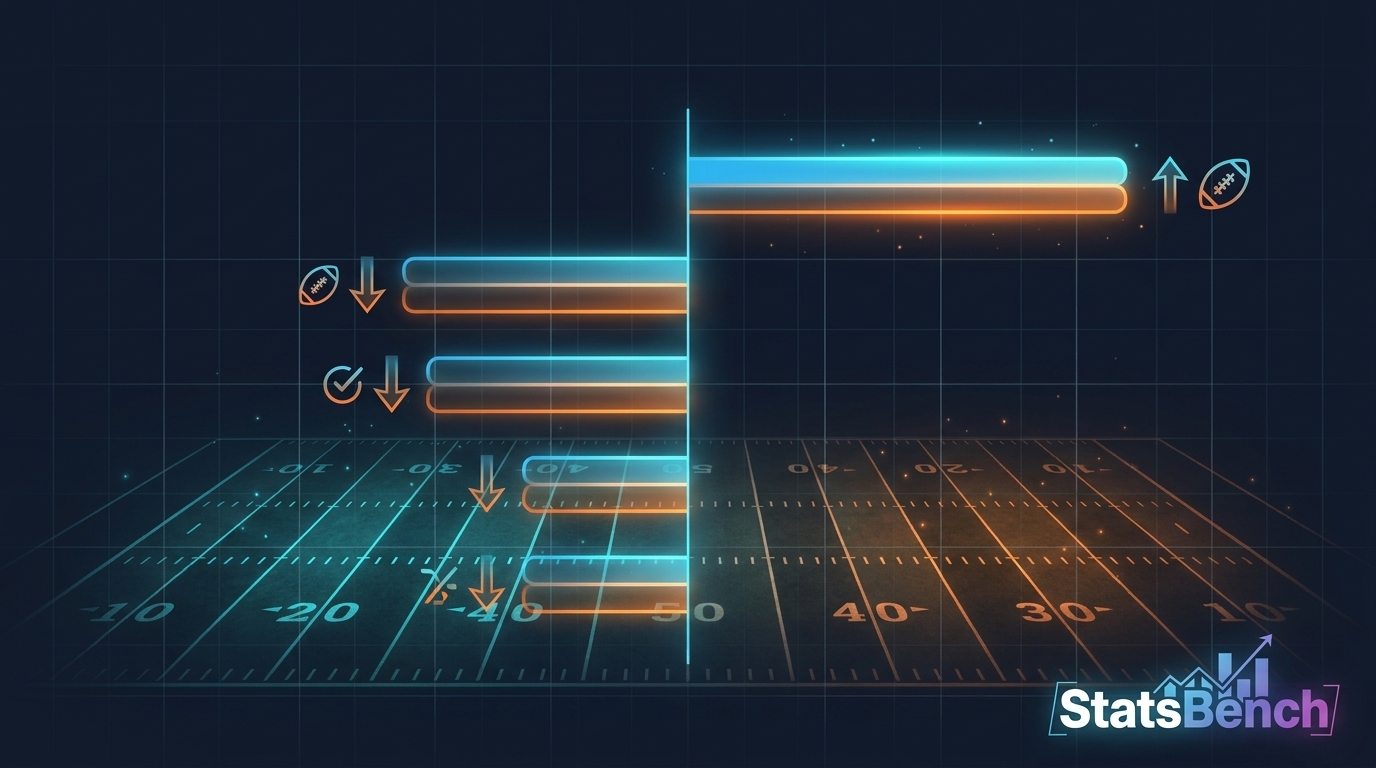
The clearest way to see the split is one player’s full board. Here’s what the StatsBench cheatsheet listed for Michael Penix Jr. ahead of Falcons at Packers on Sept 24, 2026.
| Prop | Line | Hit rate (sample) | Edge | Best price |
|---|---|---|---|---|
| Passing + rushing yards | 212.5 | 60% (3/5) | +8.1% | -112 |
| Passing yards | 205.5 | 60% (3/5) | +7.3% | -110 |
| Longest rush | 4.5 | 60% (3/5) | +2.1% | -107 |
| Passing attempts | 31.5 | 60% (3/5) | -1.3% | -109 |
| Passing completions | 18.5 | 60% (3/5) | -0.9% | -120 |
Start with the hit rate column, because that’s the trap. Every prop on the list shows 60%. Sort by hit rate and you’d have five identical-looking bets.
The edge column breaks the tie. The passing attempts line, at -1.3%, is the one to pass on. The passing + rushing combo, at +8.1%, carried the biggest number on that board.
One warning before you get excited. Three games out of five is a tiny sample, so that 60% is a count, not a track record. More on that below.
Why the secondary markets move more

Direct answer: thinner markets attract less two-way action, so a book has fewer bets with which to correct a bad number.
Look at the two ends of that snapshot. Passing attempts (31.5) is a volume stat that models project well, and StatsBench priced it slightly negative at -1.3%. The combo line (212.5) blends passing and rushing yards, two markets books price separately, and a blended number has more room to go stale.
Stack that logic across a full weekend and a pattern shows up. Coaches and game scripts decide attempts before kickoff. Rushing yards for a pocket quarterback depend on scrambles, which are rarer and noisier. Combined lines inherit the noise from both halves.
None of that makes the combo a winner. An edge is a long-run idea (expected value is the average result of a bet repeated hundreds of times). It says the price is better than the market’s own estimate of the true probability, not that the bet cashes on Sunday. Edges get graded over big samples, and any single one can lose.
How to read a quarterback prop in five steps
Do the math first, then the research. Most bettors do it backwards and fall for a stat before they check the price.
- Turn the price into a probability. A -112 price implies 52.8%. A -120 price implies 54.5%. Two props can look identical on paper, but the cheaper price is the better bet. The implied probability calculator does it in one step.
- Compare that price to fair value. Edge is the gap between what you’re paying and what the line should cost. The EV calculator turns both numbers into one figure you can rank.
- Check the sample behind the hit rate. Three of five games swings hard in both directions. A full season, or the last 20 games, tells you more than the first three weeks of September.
- Name the market type. Headline passing yards, or a secondary volume line? It changes how much weight the number deserves.
- Find the best price. The NFL props board lists hit rates, consistency, edges, and the best available price per prop across roughly 60 sportsbooks.
The same read works in any league. Our Caitlin Clark props reader walks through the process line by line for WNBA markets.
Where the best price actually comes from
Direct answer: from shopping more than one book. StatsBench tracks roughly 60 sportsbooks and shows the best available number for every prop, which is a quieter edge than any model output.
The math is unglamorous. Betting -120 instead of -110 costs you about two percentage points of implied probability on every stake. That gap is often bigger than the edge you’re chasing on the prop itself.
On the Sept 24 board, the best price on Penix’s passing + rushing combo was -112. If your only book posts it at -130, you’re not making the same bet, even though the line still reads 212.5.
Odds and edges move all day, and StatsBench refreshes its edge feed every minute. Pro accounts see the full feed; free accounts see a slice of it. Consistency grades in the same table give you a sanity check on any hot hit rate you spot.
What a tiny September sample does to a hit rate
Direct answer: it makes the percentage useless on its own. Every Penix prop in that snapshot carried a 3/5 sample, so all five hit rates landed on 60% by coincidence as much as anything else.
Three games can’t separate a quarterback who clears 205 passing yards every week from one who just happened to. Variance cuts both ways early in a season. A lucky 60% looks like a trend, and a shaky 40% looks like decline when neither is proven yet.
A better baseline starts with last season’s game log (official ones live on NFL.com), the team’s pass rate in neutral game script, and the opponent’s habit of giving up attempts or rushing yards to quarterbacks. Then treat this season’s games as a small update, not the whole argument. Our guide to sample size in betting covers how many games a hit rate actually needs.
For one market worked end to end, the NFL passing yards props guide walks through line reading, matchups, and how to weigh recent volume.
How to use this on Sunday
Run the same four checks on every quarterback prop you consider, in this order:
- Sort the board by edge, not by hit rate.
- Mark which props are headline markets and which are secondary.
- Convert the two or three prices you’re deciding between into implied probabilities.
- Check the sample behind any hit rate that catches your eye.
A high hit rate with a negative edge is a pass. A modest hit rate at a generous price is where research pays off, and where the hit rate vs edge comparison earns its keep.
Bet within your means. Edges show up over hundreds of bets, not one Sunday, and any single prop can lose. If betting stops being fun, call 1-800-GAMBLER. 21+.
Live board
See today’s NFL player props on StatsBench
Live lines, last-10 hit rates and the best price across about 60 books.
Open the NFL player props board →
Prefer email? Get the daily picks newsletter.
Frequently Asked Questions
Where do the biggest edges show up in NFL QB props?
Usually in the thinner markets. In StatsBench’s Sept 24, 2026 snapshot, one quarterback’s passing + rushing yards line showed an 8.1% edge while his passing attempts line sat at -1.3%. Headline markets like passing yards take the most action, so they get corrected fastest.
Does a 60% hit rate mean a prop is a good bet?
No. Hit rate ignores the price you’re paying. In that same snapshot, five props all showed 60%, but their edges ranged from +8.1% to -1.3%. Price and market type do more work than the percentage.
What does an edge of 8.1% actually mean?
It’s the gap between the best available price and StatsBench’s read of fair value for that prop. An edge is a long-run concept, so a single bet can still lose. It says the price is good, not that the result is settled.
How many games do you need before a QB prop hit rate is trustworthy?
More than three. Early-season samples swing in both directions, so a 3/5 count is mostly noise. Use a full previous season or the last 20+ games as your baseline, then treat this season as a small update.
Can I research NFL QB props on StatsBench for free?
Yes. The NFL props board is open to browse with hit rates, consistency grades, edges, and pricing by prop. Free accounts see a slice of the edge feed, and Pro unlocks the full feed across roughly 60 sportsbooks.