
What does sample size mean in betting?
Sample size in betting is simply how many past events a stat is built from. A prop that hit 6 of its last 10 games has a sample of 10. That 60% looks tidy on a cheatsheet, but ten games is a tiny window, and small windows lie. The core skill is knowing when a hit rate is telling you something real and when it’s just noise wearing a percentage sign.
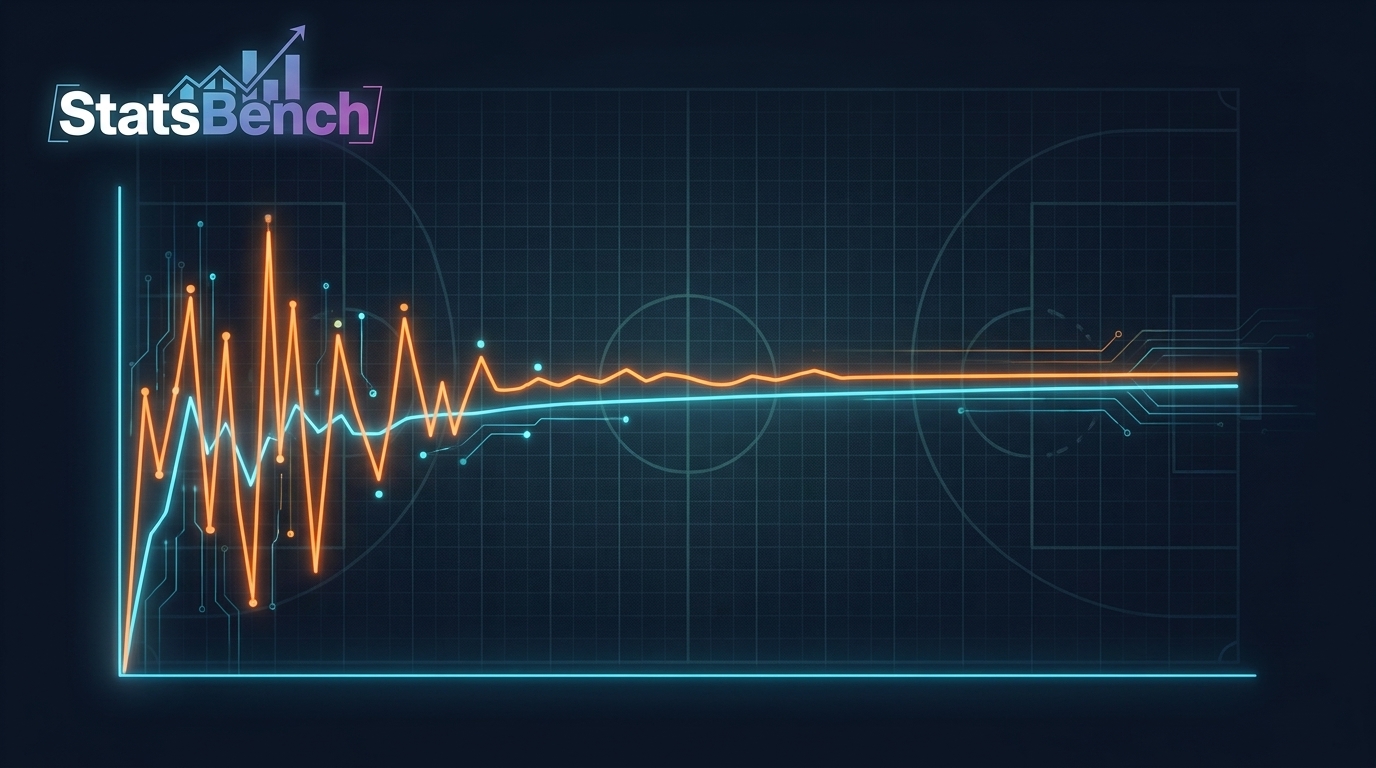
Here’s the short version. Small samples move a lot on one or two games. Large samples barely move at all. So the same 60% number can mean very different things depending on whether it came from 10 games or 100.
A hit rate without its denominator is not a stat, it’s a vibe.
Why 6 of 10 is not the same as 60 of 100
Both read as 60%. They are not close to equally trustworthy.
Think about what one extra game does. In a 10-game sample, a single miss drops you from 60% to 50%. In a 100-game sample, a single miss moves you from 60% to about 59.4%. The bigger sample resists noise. That’s the whole idea.
Coin flips make this obvious. Flip a fair coin ten times and 7 heads happens often enough that nobody blinks. Flip it a thousand times and 700 heads would be extraordinary. Same coin, same 70%, wildly different meaning. If you want the formal version, the law of large numbers is the concept doing the work here.
- 5 to 10 games: a form check, not evidence. Useful for context (usage, role, injury).
- 20 to 30 games: starting to be meaningful for stable stats like minutes or shots.
- 50+ games: now a hit rate is worth leaning on, if the role hasn’t changed.
What a real 10-game sample looks like
This is where honesty beats hype. Look at actual StatsBench cheatsheet data from a July 26, 2026 MLB slate. Several props showed a 60% hit rate, and the samples behind them were small.
| Player (MLB) | Prop | Hit rate | Sample | Best price |
|---|---|---|---|---|
| Chandler Simpson (TB vs CLE) | Hits+Runs+RBIs o/u 1.5 | 60% | 6 of 10 | -110 |
| Cedric Mullins (TB vs CLE) | Hits+Runs+RBIs o/u 0.5 | 60% | 6 of 10 | -185 |
| Brayan Rocchio (CLE @ TB) | Hits+Runs+RBIs o/u 1.5 | 60% | 6 of 10 | +110 |
| Ryan Vilade (TB vs CLE) | Total bases o/u 1.5 | 60% | 3 of 5 | +120 |
| Jonathan Aranda (TB vs CLE) | Batter strikeouts o/u 1.5 | 60% | 6 of 10 | +194 |
Notice the Vilade line. It reads 60%, but the sample is 3 of 5. Five games. One different outcome and it’s 40%. Same headline percentage as the 6-of-10 rows, roughly half the evidence.
Per StatsBench data from that same July 2026 snapshot, the edges attached to these props were mostly under 1.5%. That is a normal, honest number for a screened prop. It also means the margin between a good bet and a bad one is thin enough that your sample discipline actually matters.
How many games do you actually need?
It depends on how noisy the stat is. Volume stats settle down faster than event stats.
Stable stats (need fewer games)
Minutes, shots on goal, batter plate appearances, receiving targets. These are driven by role. A player who bats second gets four or five trips most nights. Twenty games can tell you a lot.
Noisy stats (need many more games)
Home runs, anytime touchdowns, goals, RBI totals. These depend on rare events. A 10-game window on a home run prop is close to meaningless. You’d want a full season or more, plus the underlying rate stats (barrel rate, red zone touches) instead of the yes/no outcome.
A rough rule I use: the rarer the event, the longer the lookback needs to be. If the prop hits once every three games, ten games gives you about three “yes” outcomes to learn from. That’s not a sample, that’s an anecdote.
The trap: bigger samples that stopped being relevant
More games isn’t automatically better. Sample size and sample relevance are two different problems, and chasing one can wreck the other.
Say a guard averaged 12 shots a game for 60 games, then his team traded for a star and his usage fell. That 60-game sample now describes a player who no longer exists. You’ve got great statistical power aimed at the wrong question.
Things that break a sample’s relevance:
- A trade, a new coach, or a lineup change
- Returning from injury, especially with a minutes cap
- A batting order or depth chart move
- Playoff rotations, where minutes tighten and benches shrink
So you’re balancing two forces. Too few games and you’re reading noise. Too many and you might be reading history. We wrote more about that tension in why “last 10 games” is a trap in NBA prop betting, and the same logic travels to every sport.
How to read hit rates without fooling yourself
Four habits that keep small samples from costing you money.
- Always look at the denominator. 6/10 and 3/5 are not peers. Sort by sample when your tool lets you.
- Ask why, not just how often. A 60% hit rate is a starting question. Is it the role, the matchup, or luck?
- Compare hit rate to the implied price. A prop at -185 needs roughly 65% to break even. A 60% hit rate at that price is not an edge, it’s a leak. Our implied probability guide covers the math.
- Track your own bets. Your personal results are a sample too, and 40 bets tells you almost nothing about your skill.
That last point catches good bettors. Two hundred bets is still a modest sample for judging a strategy. Variance can hide a real edge for months, and it can also disguise a bad process as a hot streak. Regression to the mean eventually shows up for everyone, which is exactly why we wrote a bettor’s guide to regression.
Where sample size fits into +EV betting
Expected value is a long-run statement. It says that if you repeat this bet many times at this price, you profit on average. Nothing about EV promises anything on a Tuesday in July.
That’s why sample size matters on both sides of the equation. You need a decent sample to trust the probability estimate going in. Then you need a large sample of bets before your results say much about whether your estimates were right.
StatsBench handles the first half. The Positive EV Scanner recomputes fair prices from sharp books about every minute and flags soft-book edges, and the Prop Finder lets you filter by hit rate, consistency and sample so you’re not squinting at a 3-of-5 line and calling it a trend. The MLB strikeout research page does the same job for pitcher K props, showing pitch mix and opponent whiff data instead of a bare percentage.
The second half is on you. Bet sizes you can repeat, a journal, and patience. The free Bet Tracker with any account handles the record-keeping part.
Quick reference: sample size sanity checks
- Under 10 games: context only. Don’t price a bet off it.
- 10 to 20 games: fine for stable volume stats, weak for rare events.
- 30 to 50 games: reasonable confidence if the player’s role is unchanged.
- Season-long or multi-season: best statistical footing, but check for role changes first.
- Your own bet log: think in hundreds, not dozens.
None of this makes betting safe. Props swing, favorites lose, and a correct process can look wrong for weeks. Bet money you can afford to lose, keep it entertainment, and if it stops being fun, call 1-800-GAMBLER. Must be 21+ and betting laws vary by state and country. For official league stats to sanity-check any number you see, MLB.com’s stats hub is a good free source.
Put it into practice
Next time you see a shiny hit rate, find the sample before you find the bet. It takes three seconds and it will kill more bad wagers than any system you buy.
Want to see hit rates with their samples attached, plus best available price across books? Grab the free player prop cheatsheet. It’s free, it takes an email, and it shows you exactly the kind of screened props in the table above so you can judge the sample for yourself.
Free preview
See today’s MLB player props on StatsBench
Live lines, last-10 hit rates and the best price across about 60 books. No account needed to look.
Open the MLB player props board →
Prefer email? Get the daily picks newsletter.
Frequently Asked Questions
How many games is a good sample size for a player prop?
It depends on the stat. For stable volume stats like minutes, shots or plate appearances, 20 to 30 games gives you something usable. For rare events like home runs or touchdowns, you want a full season or more, plus underlying rate stats rather than yes/no outcomes.
Is a 60% hit rate over 10 games good?
It’s a starting point, not evidence. In a 10-game sample, one different outcome swings the number by 10 percentage points. Always check the price too: a 60% hit rate at -185 is below break-even, so the number alone doesn’t make it a good bet.
Can a sample be too big?
Yes, if it’s no longer relevant. A 60-game sample built before a trade, a coaching change or an injury return describes a role the player no longer has. Balance statistical size against how much the situation has changed.
How many bets do I need before I know if my strategy works?
Think in hundreds, not dozens. Even a few hundred bets leaves plenty of room for variance to hide a real edge or flatter a bad one. Tracking closing line value alongside results gives you a faster read than profit alone.
Does sample size matter for +EV betting?
It matters on both ends. You need a solid sample to trust the probability estimate behind a bet, and you need a large sample of bets before your results say anything about whether those estimates were accurate. Expected value is a long-run statement, never a per-night guarantee.