
What does “distribution” mean in betting?
The distributions meaning that matters to a bettor is simple: a distribution is the full spread of outcomes a player can produce, plus how often each one shows up. An average squeezes all of that into one number. A distribution keeps the detail, and the detail is where prop value hides.
Say a hitter averages 1.5 total bases per game. That average could come from a steady diet of singles. It could also come from six quiet games and four multi-homer nights. Same mean, completely different bet.
Props settle on single games, not on averages. So you need to know how often a player clears the line, not what his season number rounds to.
Why the average is the worst number on the screen
Averages get abused because they’re easy. Every stat page leads with them. But a mean is fragile, and props are decided by frequency.
Here’s the classic trap. Two WNBA guards both average 4.0 assists. Guard A goes 4, 4, 3, 5, 4. Guard B goes 1, 9, 2, 7, 1. On an over 3.5 assists line, Guard A cashes four times out of five. Guard B cashes twice.
The average said they were identical. The distribution said one is a coin flip and the other isn’t.
- Mean: the center of the outcomes.
- Spread: how far outcomes stray from that center.
- Shape: whether the outcomes pile up on one side (skew).
- Tails: the rare, extreme games that inflate averages.
You can read all four off a game log. Most bettors read one.
The three distribution shapes you’ll actually meet
Tight and symmetric
Minutes-driven, volume-driven stats behave this way. Shots on goal for a top-line NHL winger. Rebounds for a starting center who plays 32 minutes every night. Outcomes cluster near the middle, and the tails are thin.
These props are the ones where a hit rate over a decent sample actually means something. If the line sits well below the cluster, the over is a real edge and not a hope.
Right-skewed (the lottery-ticket stats)
Home runs, receiving touchdowns, MLB total bases, anytime-scorer markets. Most games are a zero. A few games are huge. The average lands above the typical game because the tail drags it up.
That’s why “he averages 1.4 total bases” can still mean he fails an over 1.5 line most nights. For skewed stats, always use the median and the raw clear rate.
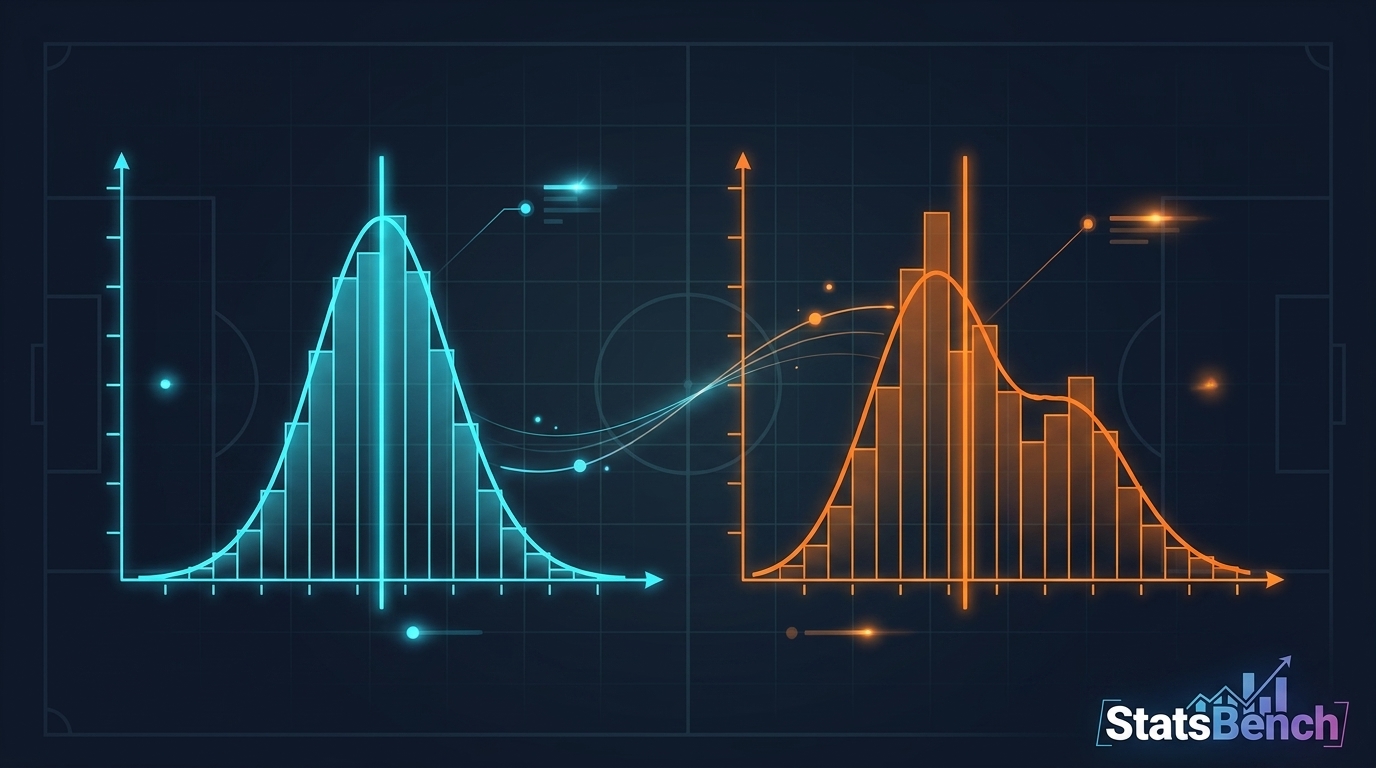
Lumpy and bimodal
Usually a role problem, not a talent problem. A pitcher who alternates between 6-inning starts and 3-inning outings. A bench scorer whose minutes swing with blowouts. Two clusters, nothing in the middle.
Bimodal props are where hit rates lie the loudest. A 60% hit rate built from two different roles isn’t one 60% bet, it’s two bets with different prices.
How a distribution turns into a fair price
A price is just a probability with juice bolted on. So the workflow is short.
- Build the outcome spread from the game log (and split it by role, park, opponent hand, home/away where it matters).
- Count the share of games that clear the line. That’s your probability.
- Convert the odds to implied probability and compare.
- If your number is higher than the book’s, you’ve found an edge worth sizing.
Step three is where most people stop doing math. Our implied probability guide covers the conversion and why 52.4% is the break-even bar on a standard -110 line.
One caution. A 10-game log gives you a rough shape, not a reliable probability. Small samples exaggerate spread and hide tails. If you want the honest version of how many games you need before trusting a rate, read our piece on sample size in betting.
A real snapshot: what a 60% hit rate looks like up close
Here’s real StatsBench cheatsheet data from a July 27, 2026 MLB slate (Rangers vs. Mariners). Every row below cleared in 6 of the last 10 games, so the raw hit rate is identical. The edges are not.
| Player | Prop | Hit rate | Edge | Best price |
|---|---|---|---|---|
| Wyatt Langford | Hits+Runs+RBIs o1.5 | 60% (6/10) | 1.5% | -110 |
| Ezequiel Duran | Hits+Runs+RBIs o1.5 | 60% (6/10) | 0.6% | -110 |
| Wyatt Langford | Runs o0.5 | 60% (6/10) | 0.4% | -115 |
| Ezequiel Duran | Total bases o1.5 | 60% (6/10) | 0.3% | +125 |
| Wyatt Langford | Batter strikeouts o0.5 | 60% (6/10) | 0.2% | -289 |
Source: StatsBench cheatsheet, July 27, 2026.
Look at the two Langford rows. Same 6-for-10 clear rate, wildly different prices. The strikeout prop at -289 needs roughly a 74% true probability just to break even, so a 60% rate over ten games is nowhere near enough. The hits+runs+RBIs line at -110 needs about 52.4%.
The hit rate tells you the shape; the price tells you whether the shape is worth buying. That’s the whole reason the same percentage produces a 1.5% edge in one row and 0.2% in another.
Also note the Duran total bases row priced at +125. Total bases is a skewed stat, and a plus-money price on a 60% recent clear rate is exactly the kind of gap worth a second look. It’s also the kind of prop where ten games is a thin sample, because one multi-hit game moves the whole picture.
Distribution mistakes that quietly cost money
- Reading the mean on a skewed stat. Use the median and the clear rate for home runs, touchdowns and total bases.
- Ignoring role changes. A trade, an injury to a teammate, a lineup-spot move: each one creates a new distribution. Older games belong to the old one.
- Treating alternate lines as linear. The jump from over 1.5 to over 2.5 is not a straight line, because the tail thins fast.
- Confusing a hot streak with a shifted center. Most streaks are the tail of the same distribution. See our note on why “last 10 games” can be a trap.
- Forgetting variance in your own results. A real edge still loses for weeks. That’s normal.
Where distributions and correlation meet
Parlays make distribution thinking mandatory. When you stack two props from the same game, their outcomes are linked, so the combined spread isn’t the product of two independent ones. A pitcher’s strikeout total and his innings pitched move together. So do a quarterback’s passing yards and his receiver’s receptions.
If you build same-game parlays, understanding correlation is the other half of this skill. Positive correlation raises your true parlay odds above the naive math. Negative correlation quietly destroys them.
Tools that do the counting for you
You can build all of this by hand in a spreadsheet. Plenty of sharp bettors did, for years. It’s just slow, and the slow part is the counting, not the thinking.
StatsBench handles the counting side. The Pro Cheatsheet shows hit rates and consistency grades in one sortable table, with the best available price across roughly 60 sportsbooks. Consistency Grades exist precisely for the problem in this article: they separate the steady clusters from the lumpy ones. The Positive EV Scanner recomputes fair prices from sharp books every minute and flags where soft books lag.
For pitchers, the MLB strikeout tool shows pitch-mix whiff rates and opponent K-vulnerability by hand, which is how you tell whether a strikeout distribution should shift for a given matchup. It’s matchup research, not a projection.
If you want a primer on the wider stat vocabulary, the Wikipedia entry on probability distributions is a solid, plain-English start, and MLB’s official stats hub has the raw game logs to build your own spreads.
The takeaway
Averages compress. Distributions reveal. Before you take any prop, ask two questions: how often does this player clear the number, and does the price demand more than that? If the answer to the second is yes, pass. There’s another slate tomorrow.
Bet within your means, keep it entertainment, and remember that a real edge only shows up over a large sample. 21+ where legal. If betting stops being fun, call 1-800-GAMBLER.
Want the counting done for you? Grab the free player prop cheatsheet, see the hit rates and best prices side by side, and decide for yourself which shapes are worth buying.
Free preview
See today’s MLB player props on StatsBench
Live lines, last-10 hit rates and the best price across about 60 books. No account needed to look.
Open the MLB player props board →
Prefer email? Get the daily picks newsletter.
Frequently Asked Questions
What does distribution mean in sports betting?
A distribution is the full range of outcomes a player can produce plus how often each occurs. It shows the spread and shape of results, not just the average. Props settle on single games, so the distribution matters more than the mean.
Why is a player’s average misleading for props?
An average blends steady games with rare huge games into one number. For skewed stats like home runs or total bases, a few big games pull the mean above the typical game. Use the median and the raw clear rate instead.
How do I turn a distribution into a bet?
Count the share of past games that cleared the line to get your probability, then convert the odds to implied probability. If your number is higher than the book’s, you have an edge. Size it small and account for sample size.
Does a 60% hit rate always mean value?
No. In StatsBench cheatsheet data from July 27, 2026, two props with identical 6-of-10 hit rates showed edges of 1.5% and 0.2% because their prices differed. A 60% rate is not enough at heavy juice like -289.
What is a bimodal distribution in betting?
It’s when a player’s outcomes form two separate clusters instead of one center, usually because of a changing role. A pitcher alternating between long and short outings is a good example. Hit rates from bimodal props are unreliable without splitting by role.