
CeeDee Lamb props get priced on targets and matchups, not highlight reels. In a StatsBench snapshot from October 6, 2026, his receiving-yards line sat at 79.5 with a 60% hit rate over the 10-game sample tracked (6 of 10), a best available price of -110, and a modeled edge of 14.8%. Those last two numbers decide whether the bet is worth making. The hit rate on its own doesn’t.
Here’s how to read his lines the way a research-first bettor would. No picks, no guarantees, just the numbers that move a prop price.
How to Read CeeDee Lamb Props Without Guessing
Start with three numbers: the line, the hit rate on a sample you trust, and the best price you can find. Everything else (coverage, weather, game script) only matters if it changes one of those three.
- The line. Where the book sets the number. For Lamb, receiving yards is the headline market. Longest reception is the secondary one, and it behaves very differently.
- The hit rate. How often he cleared that number in the games being tracked. Always find the sample size sitting next to it. A 60% rate over 10 games and a 60% rate over 60 games are not the same bet.
- The price. -110 and -130 are the same wager with different math. More on that below.
- The edge. StatsBench compares the posted price to a fair price built from sharp books, then flags the gap. A big edge usually means one book is slow to move its number. It never means the outcome is certain.
What His Lines Looked Like on October 6, 2026
StatsBench scores every prop on hit rate, consistency, and modeled edge. Here’s the Dallas-Tampa Bay snapshot from October 6, 2026. Treat it as a dated example, since prices move within hours.
| Market | Line | Hit rate (10-game sample) | Best price | Modeled edge |
|---|---|---|---|---|
| CeeDee Lamb receiving yards | 79.5 | 60% (6/10) | -110 | 14.8% |
| CeeDee Lamb longest reception | 26.5 | 60% (6/10) | -114 | 3.1% |
| Dak Prescott rushing yards | 9.5 | 60% (6/10) | -112 | 2.2% |
| Emeka Egbuka receptions | 2.5 | 60% (6/10) | -143 | 0.5% |
| Bucky Irving rushing yards | 57.5 | 60% (6/10) | -110 | 1.7% |
| Kenny Gainwell rushing yards | 10.5 | 60% (6/10) | -110 | 12.2% |
Nearly every prop in that game showed the same 60% hit rate. That’s what a 10-game sample looks like: coarse, and not very useful on its own. The separation lives in the last two columns.
Lamb’s receiving-yards line carried the largest modeled edge in the game at 14.8%. His longest-reception line, same player, same matchup, produced 3.1%. Big markets get shaded hard by books because everyone bets them. Novelty markets don’t, which is why they can look tempting and still be priced close to fair.
The Numbers Behind a Receiving-Yards Line
Receiving yards come from targets, so the question is never “can he break a big one?” It’s “how many chances will he get, and how deep?”
- Route participation and target share. A receiver on the field for nearly every dropback with a 25% target share gets volume even in a quiet game.
- Depth of target. Deep targets create yards, but they also create incompletions. Six catches at 14 yards a pop clears 79.5 with room to spare.
- Catch rate and yards after catch. Volume plus efficiency is what turns eight targets into 80 yards instead of 40.
- Defensive rank vs the position. Some secondaries funnel targets to the slot. Some roll coverage over the top of the WR1. That changes how many chances he sees.
One more number is worth checking: consistency. Two receivers can both sit at a 60% hit rate, but one bounces between 40 and 120 yards while the other lives between 70 and 95. StatsBench grades consistency from 0 to 100 and lets you filter for it, which matters more on a yardage total than on a touchdown market.
The platform doesn’t project Lamb’s next game. It aggregates prop lines and odds from roughly 60 sportsbooks, then scores each prop on hit rate, consistency, and modeled edge. The output answers “is this price fair?” rather than “will he get there?” If you want the fuller market breakdown, our NFL receiving yards props guide covers how those lines get built in the first place.
Matchup, Game Script, and Weather
Once the price checks out, three things can flip the bet.
- Coverage. A shadow corner with safety help can cut a target share in half. Find out who’s expected to travel with him before you commit.
- Game script. If Dallas falls behind, pass volume climbs and the yardage line gets easier to clear. If they lead by two scores in the fourth quarter, the clock grinds and the targets dry up.
- Conditions. Wind and rain hurt deep throws most. That matters more for a longest-reception line than a yardage total, because one 30-yard throw decides the whole bet.
None of this is a reason to bet on its own. It’s the layer you apply after the math works.
Why Line Shopping Decides the Bet
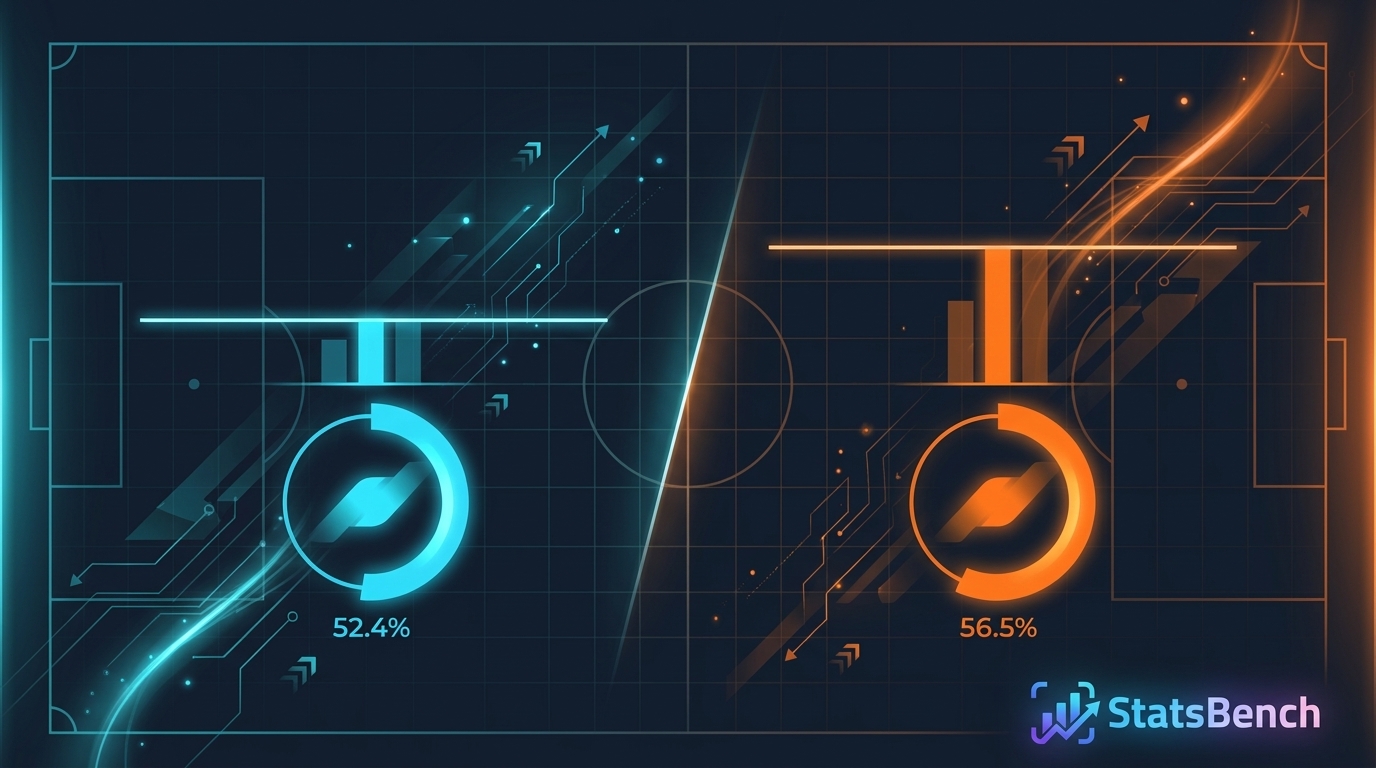
At -110, you need to win about 52.4% of the time to break even. At -130, the required rate jumps to roughly 56.5%. Same receiver, same 79.5 line, a four-point swing in what you need to be right.
In the October 6 snapshot, the best price on Lamb’s receiving-yards line was -110. Take -130 at a slower book and you hand back most of the edge the board flagged. That isn’t a small leak. It’s the whole bet.
StatsBench tracks roughly 60 sportsbooks and exchanges, and the NFL props board lists the best available price next to each line. If you’d rather run the math yourself, the free implied probability calculator turns any price into a break-even rate, and the EV calculator shows what a price gap is worth over a season of bets.
Sample Size and Variance: The Honest Part
Six of ten is a small sample. Swap two games and that 60% reads 40%. A modeled edge of 14.8% means the price sits on the wrong side of fair across a large number of bets. It says nothing about one game in October.
Good props lose constantly. That’s variance, not a broken process. Size each bet so a 0-for-5 week doesn’t change how you think, keep a log, and grade your own hit rate against the implied break-even number instead of against memory. The difference between hit rate and edge trips up more bettors than any other number on the page.
Bet within your means, and keep it fun. If it stops being fun, call 1-800-GAMBLER. This is research and entertainment, not financial advice, and 21+ only where sports betting is legal.
What to Check Before You Bet Lamb’s Number
- Find the best price across books, not the first one you open.
- Check the hit rate and the sample size behind it.
- Confirm the matchup and any late injury news in the secondary.
- Size the bet so a loss is boring.
- Log it, then grade the process instead of the result.
The same framework works on any pass catcher. Our Puka Nacua prop reader runs it against a different offense, and the Bijan Robinson props breakdown shows how the numbers shift for a running back.
For background on his career volume, CeeDee Lamb’s Wikipedia page tracks season-by-season production, and NFL.com publishes official stats and injury reports each week.
Live board
See today’s NFL player props on StatsBench
Live lines, last-10 hit rates and the best price across about 60 books.
Open the NFL player props board →
Prefer email? Get the daily picks newsletter.
Frequently Asked Questions
What was CeeDee Lamb’s receiving-yards line on October 6, 2026?
In the StatsBench snapshot from that day, his line sat at 79.5 receiving yards with a 60% hit rate over the 10-game sample tracked (6 of 10) and a best available price of -110. Lines move within hours, so treat that as an example of how the board reads rather than a current number.
What’s a good hit rate for a receiving-yards prop?
It depends on the price. At -110 you need to win about 52.4% of the time to break even, so a 60% rate would beat that break-even number over a large sample. A 10-game sample is thin though, so pair the hit rate with the price and the sample size before you commit.
Does StatsBench project how many yards Lamb will gain?
No. StatsBench aggregates prop lines and odds from roughly 60 sportsbooks and scores each prop on hit rate, consistency, and modeled edge. It’s research that tells you whether a price looks fair, not a prediction of the box score.
Should I bet his receiving yards or his longest reception?
They behave differently. In the October 6 snapshot the receiving-yards line showed a 14.8% modeled edge while the 26.5 longest-reception line showed 3.1%. Yardage totals tend to be priced tighter and hold up better against weather and game script since a single deep throw can swing a longest-reception bet.
Where can I compare prices on his props?
The StatsBench NFL props board lists best available prices across the books and exchanges it tracks, next to hit rates and modeled edges for each line. Comparing those prices before you bet is the cheapest edge available to any bettor.